Nutrition log: update
After 3 months (92 consecutive days) of logging the nutritional content of everything I consumed, here is the final picture of my diet! Note…
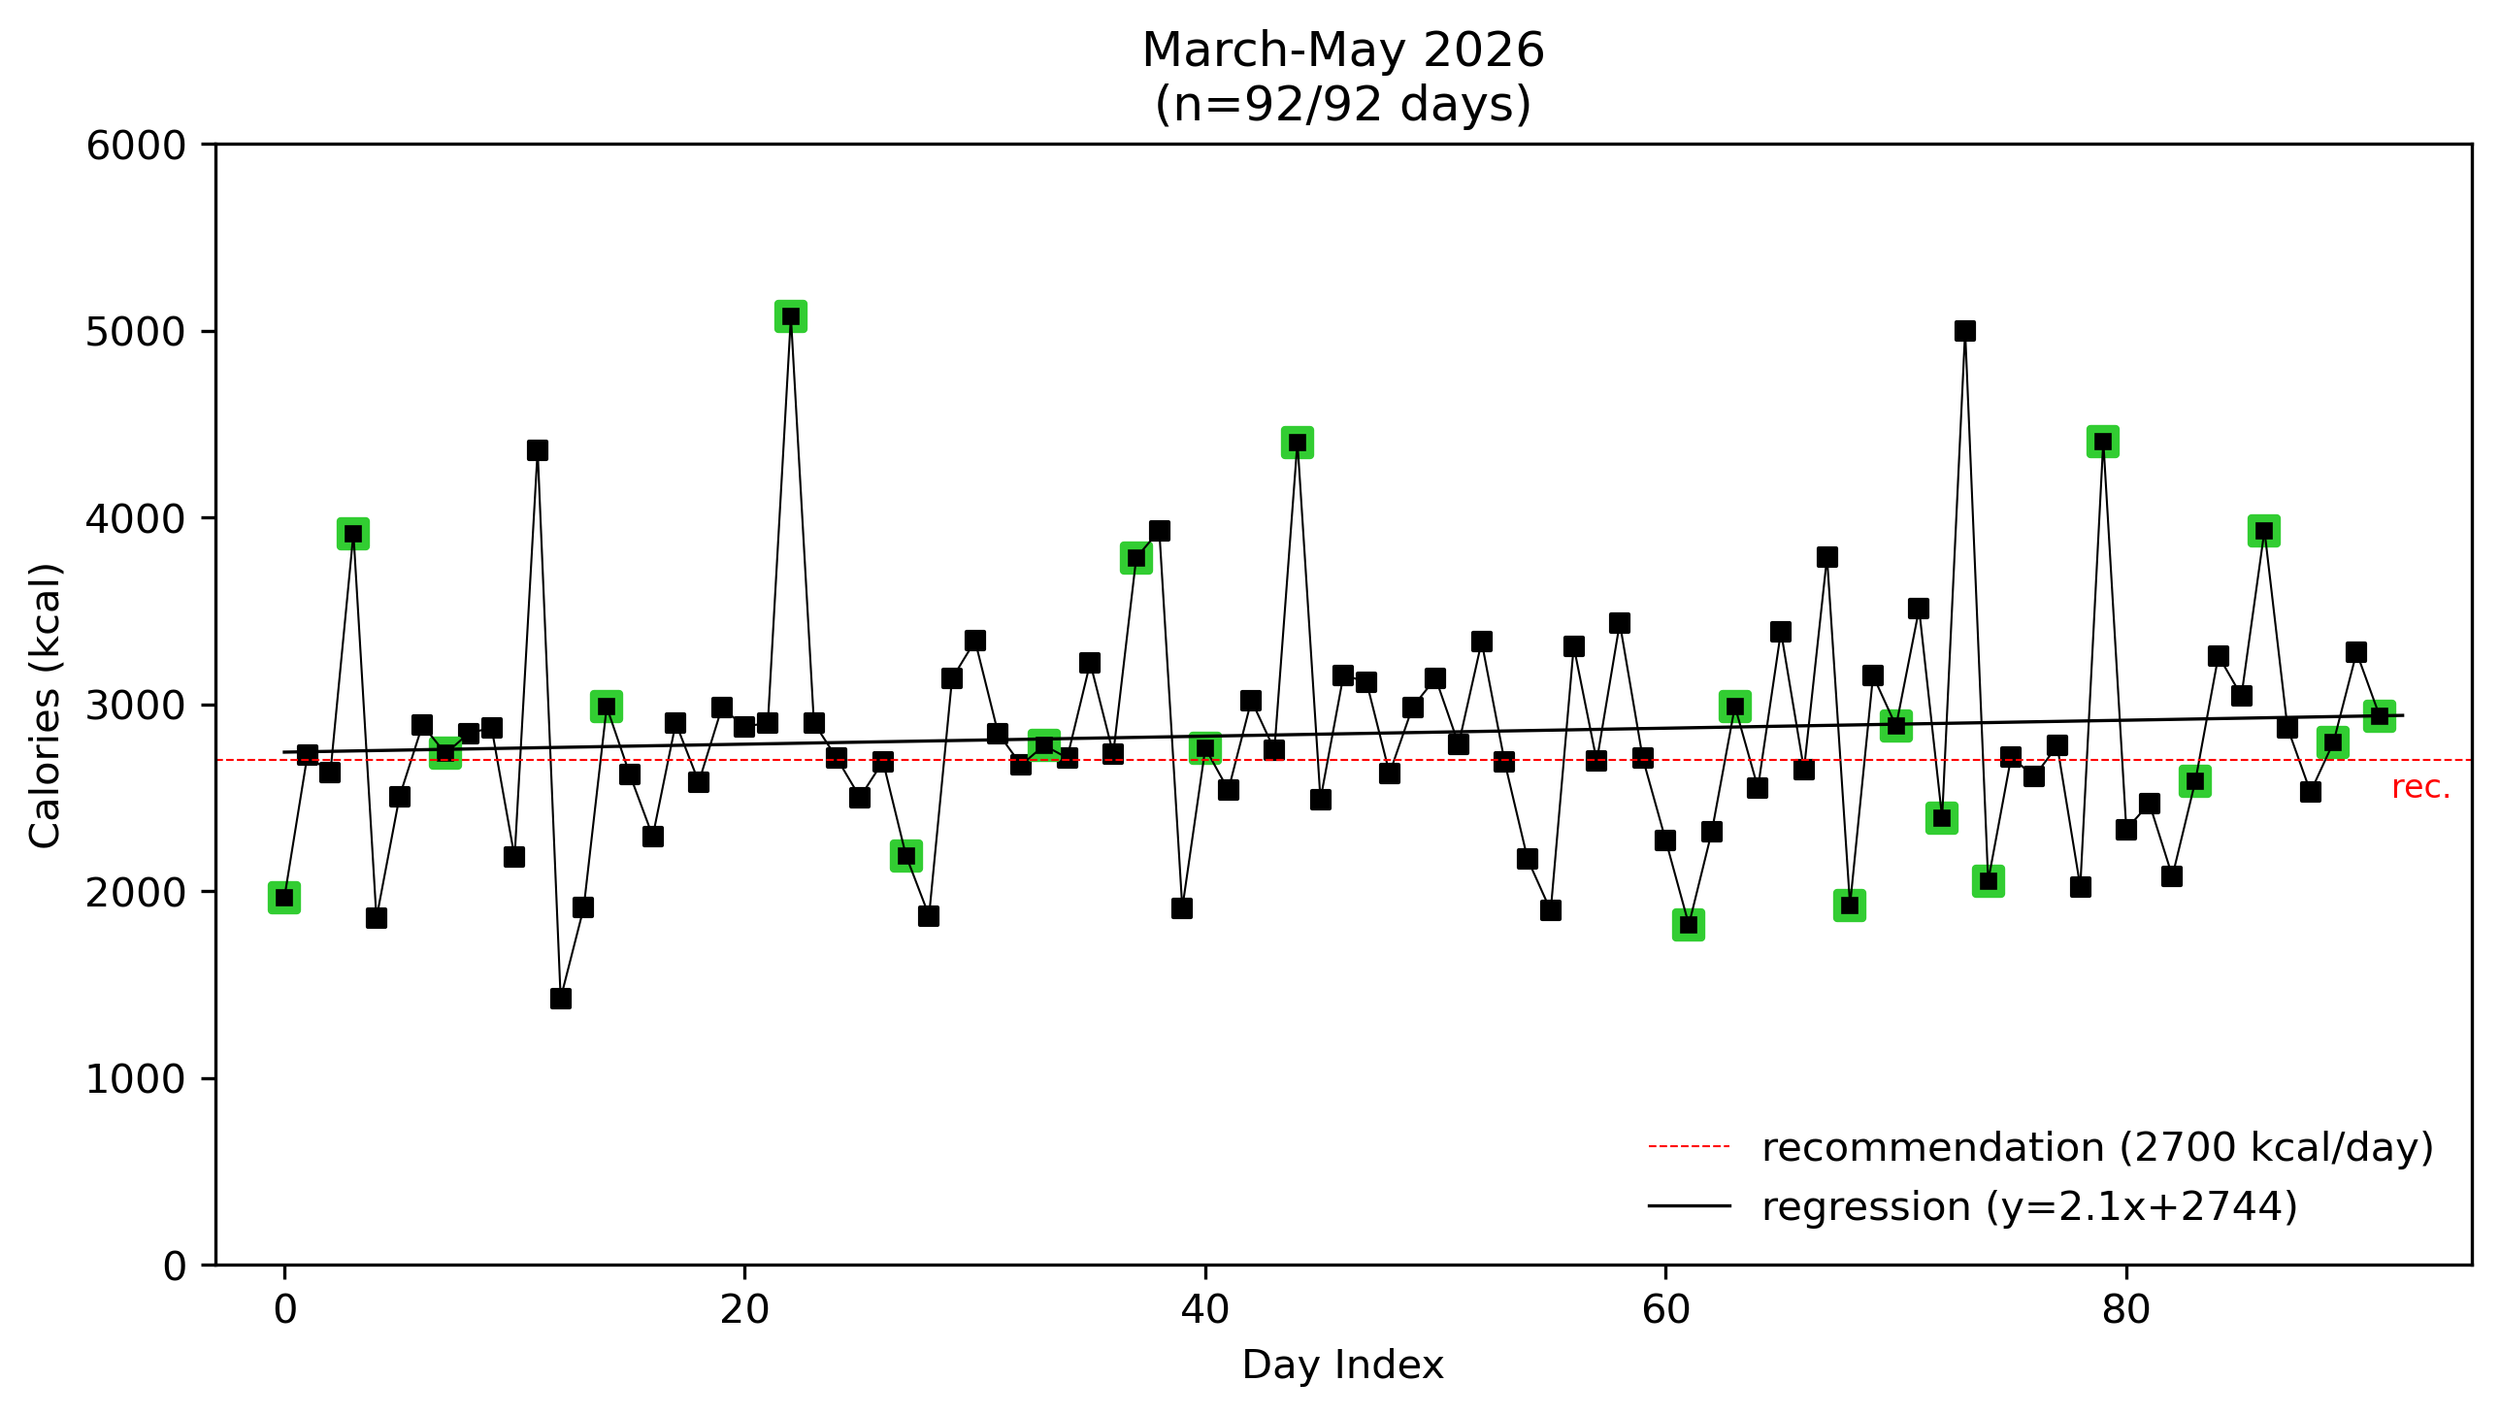
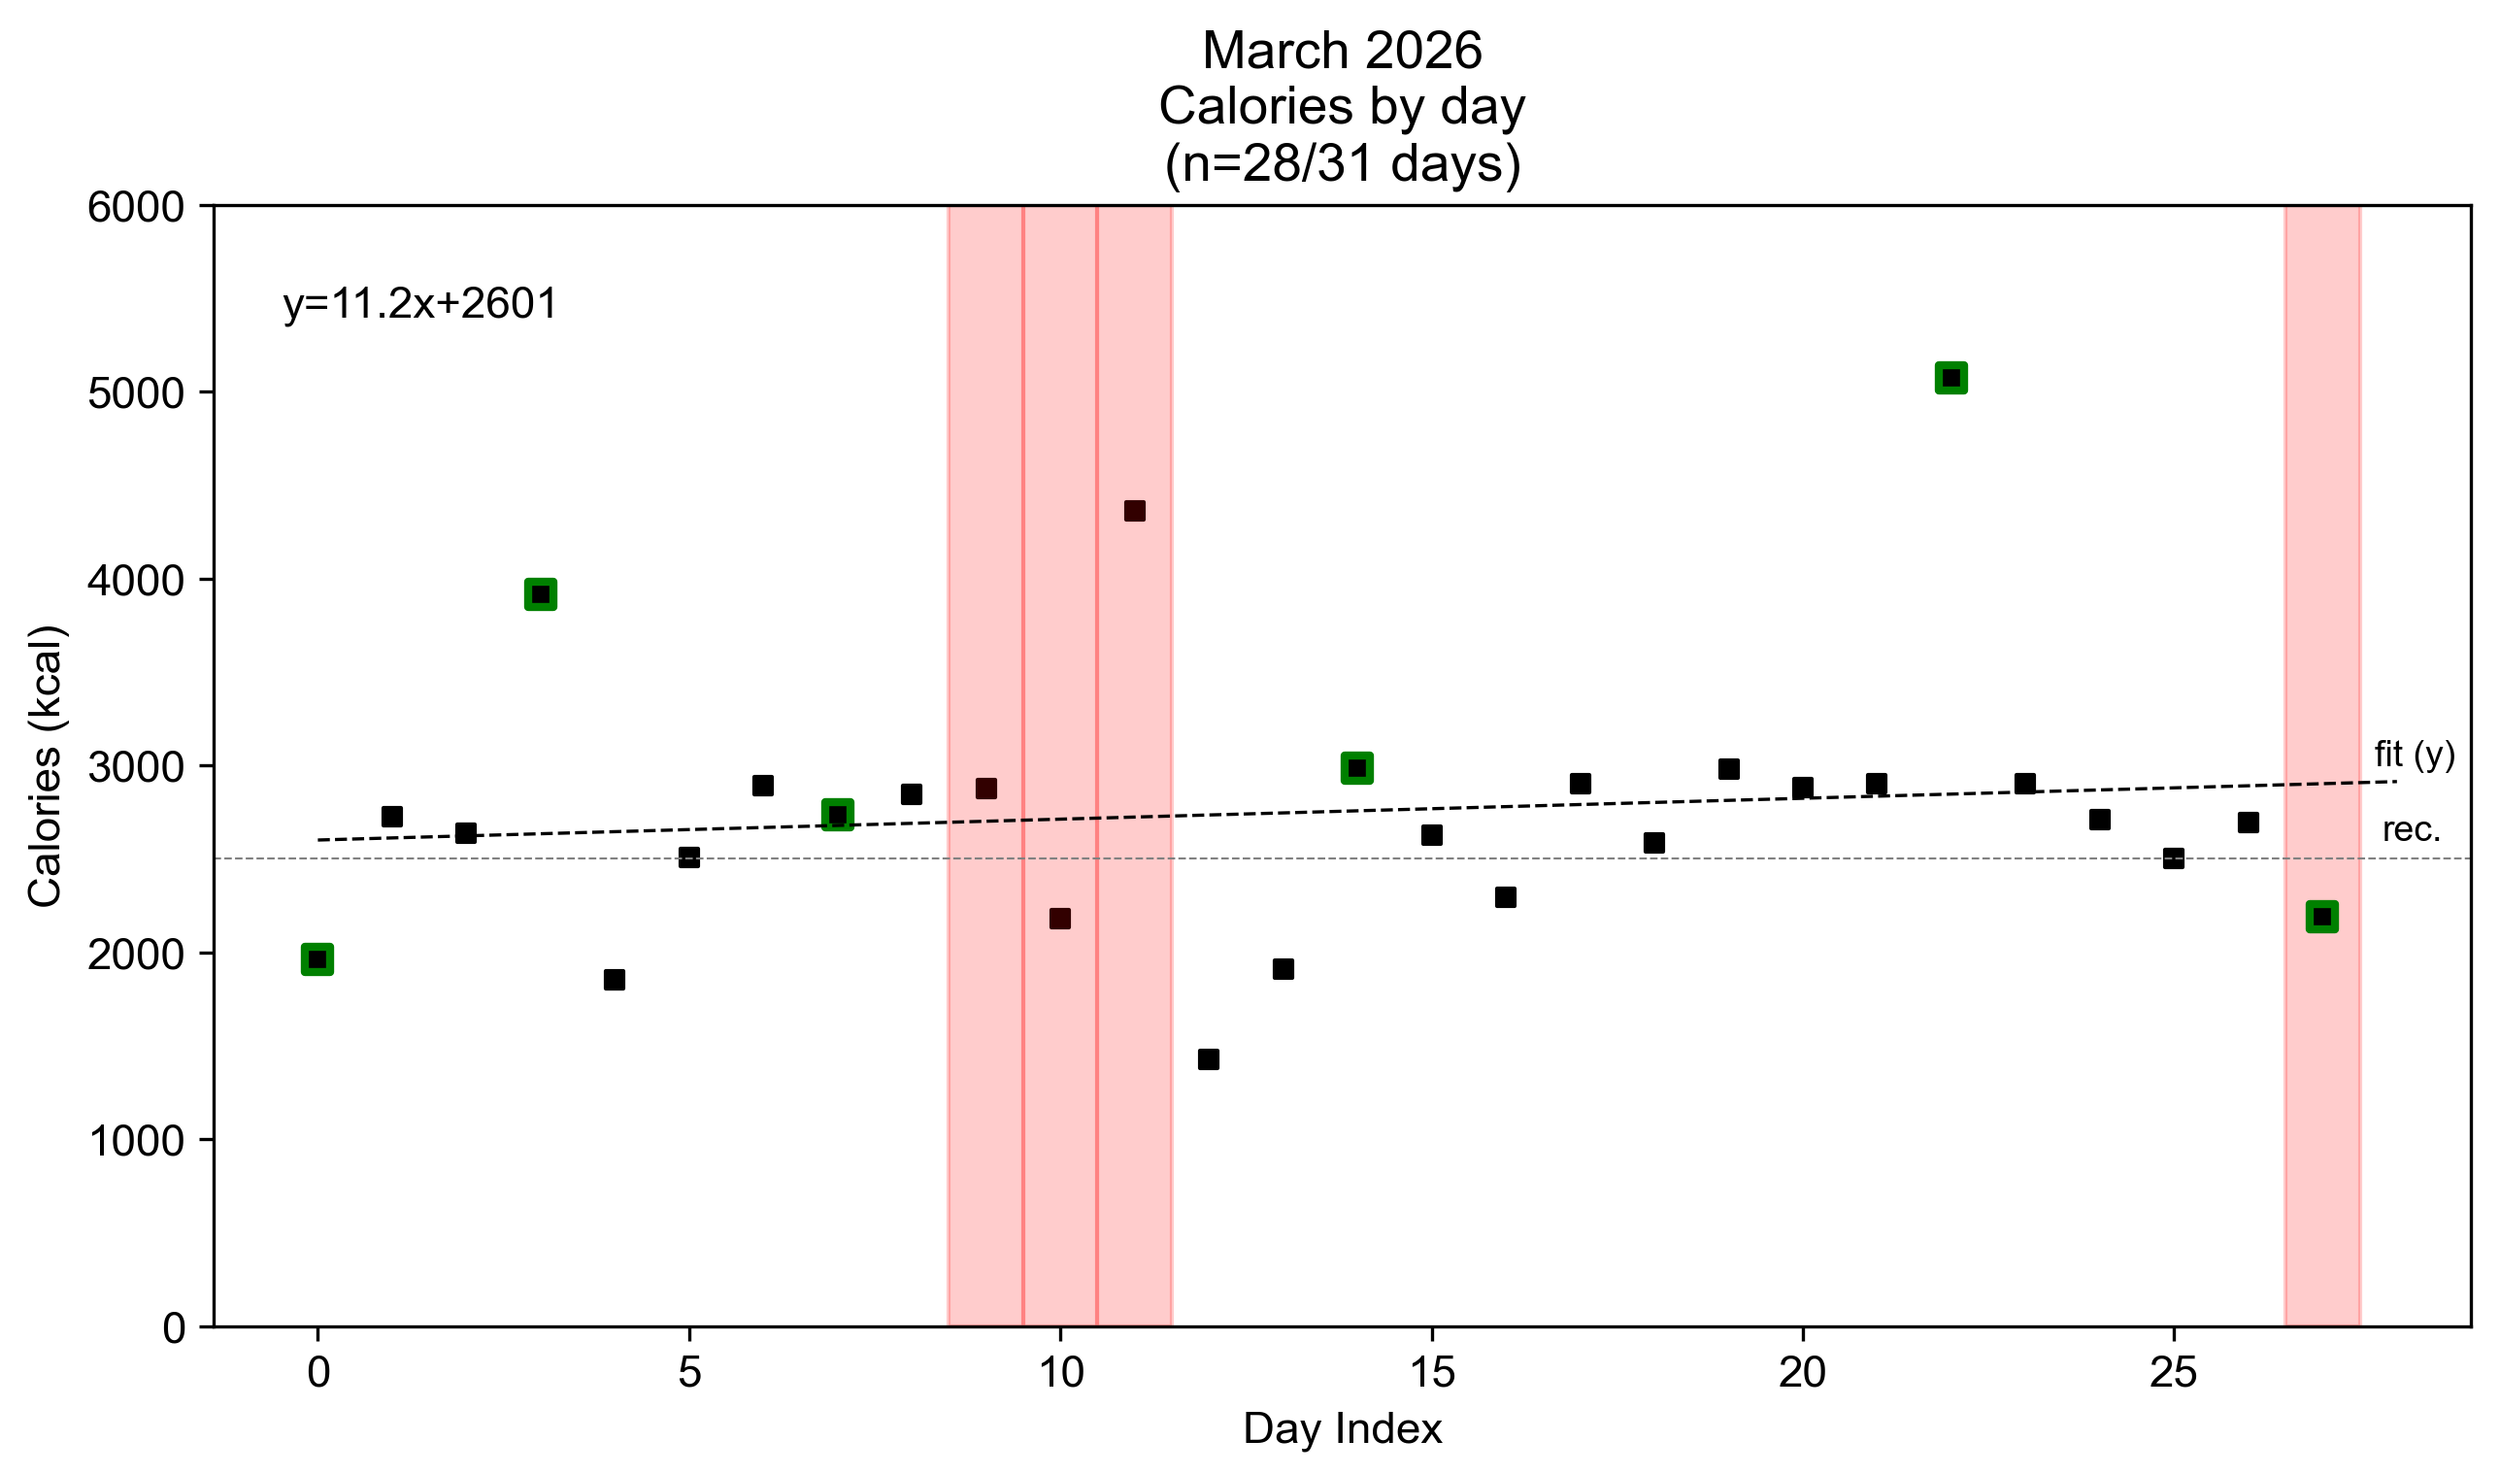
Overall, my weight held constant over this time period (fluctuated ±2 lbs month-to-month) so can view caloric intake as what’s needed for maintenance (baseline)
Took ~2 weeks off running (green highlighted squares indicate days I ran) in late April / early May (days 45-60) as I recovered from a lung/chest strain
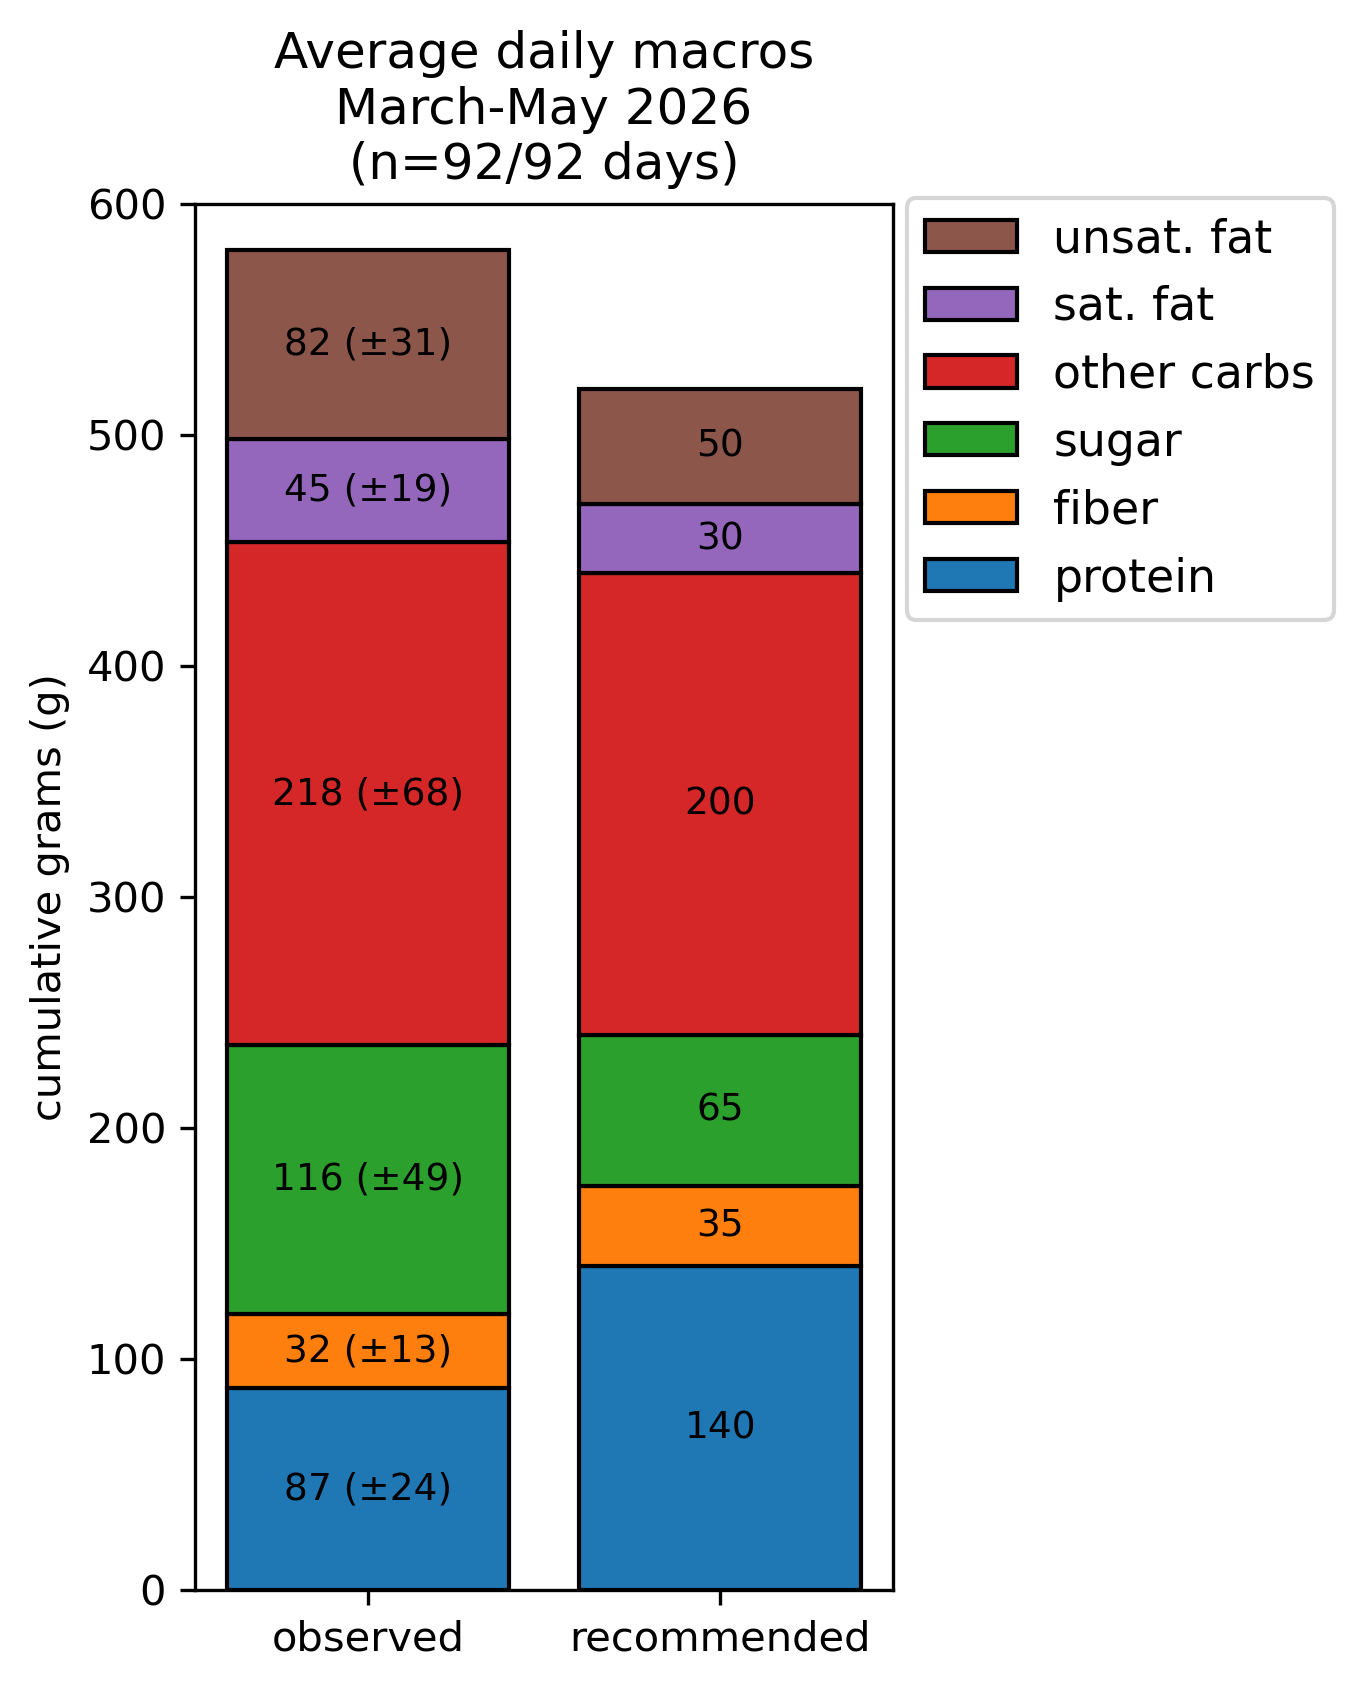
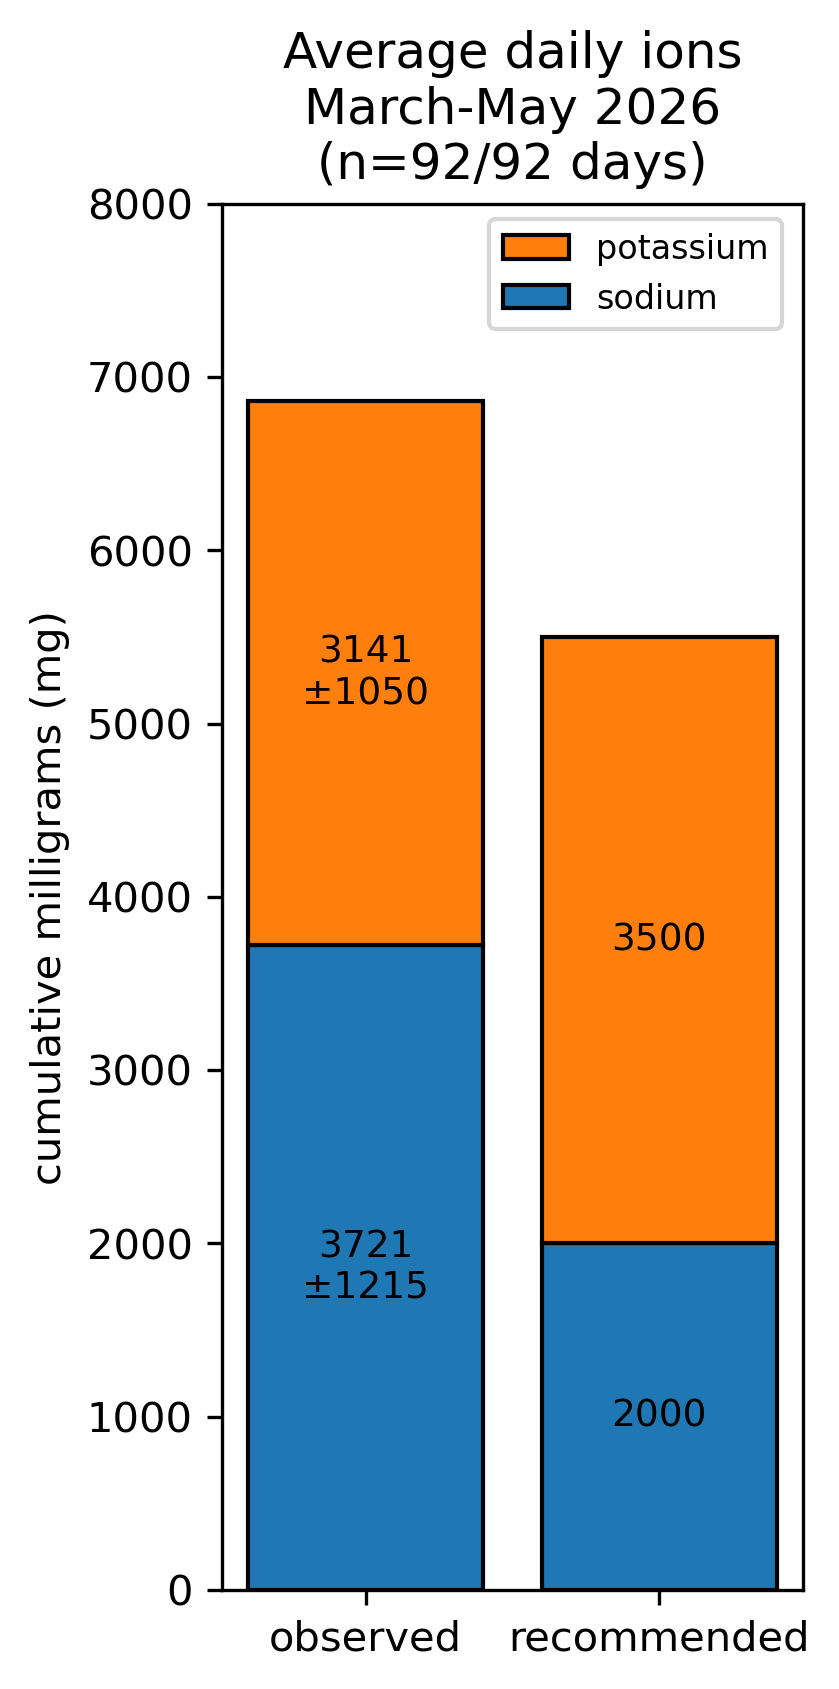
On average, I consume ~2800 kcal per day from ~600g (1.3 lbs) of food. I eat too much sugar (2x) and salt (2x) and not enough protein (0.5x)
Iced lattes, baby carrots, trail mix, and green apples were my most frequently consumed items (typical breakfast/lunch) closely followed by bagels & yogurt
In May, more conscious of potential dietary deficiencies, I started taking a multivitamin & omega 3 supplement twice daily
Great experience all around. The daily feedback definitely helps keep you in line although I’m looking forward to taking a break and not recounting everything I ate after every meal/day. Instead, in late May I purchased a Google Fitbit Air to starting tracking health indicators like sleep, heart-rate, and activity. Essentially, instead of actively tracking intake, I’ve switched to passively tracking expenditure. I liked the new Fitbit Air ($99) b/c it’s screenless & subscriptionless. So far the experience has been decent, battery lasts 5-7 days and the reported stats appear accurate. For example, it has estimated my daily caloric expenditure at 3000 kcal/day, consistent with the data above. While I don’t love having something on my wrist at all times, switching b/w the default velcro band (for sleep) and the grippier sports band (for everything else) has helped minimize it’s irksomeness. Looking forward to having more data to share!
U.S. healthcare: a case study
UPDATE: I received two more bills for my ER visit. I thought the original bill covered everything (ER services incl. intake, tests, consults, etc.) but nope, apparently those are just the hospital charges and you can expect separate bills from the 3rd party businesses that actually employ the people that took care of you. I guess that means doctors are contracted out to work at hospitals? I got 2 more Aetna EOBs to summarize the additional charges this week, one from Radiology Associates and one from Physicians Associates, again w/ insurer negotiated discounts. So strange, this should all be unified for patient billing, idc how you got your employees; I don’t expect separate charges for my groceries from the meatpacking and cashiers associations. You can see why people get frustrated. Hopefully this is the last of them. In total, I’ve now paid ~$550 for my visit w/ insurance paying ~$2220 for an effective personal cost rate of 20%
A few weeks ago, I went to the ER (all is well) and I thought an inside glimpse at how such a visit is billed in the U.S, with insurance, is interesting
Note that I’m on my school’s graduate student health insurance plan and it’s really quite exceptional. This is not the norm. Aetna is the provider.
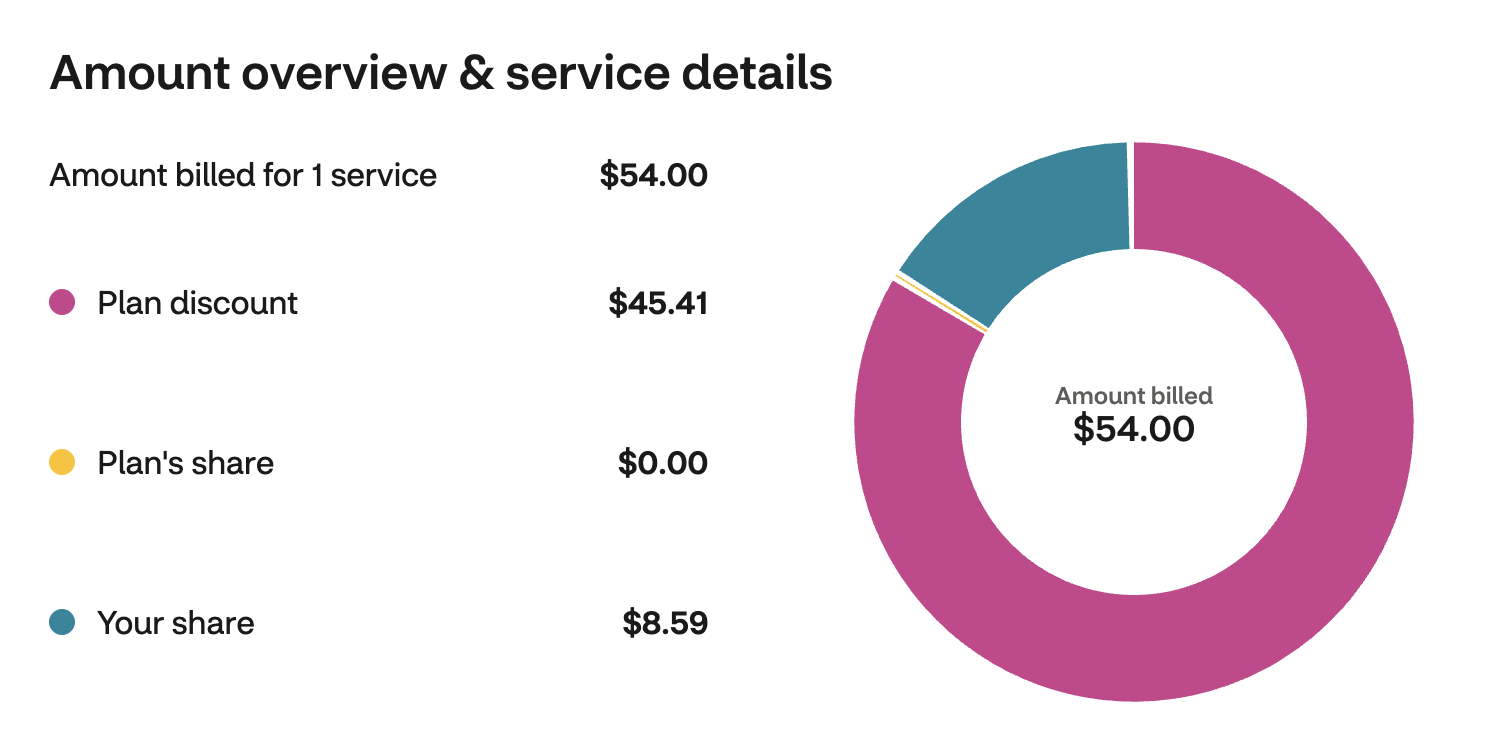
I spent a total of 3.5 hours at the hospital & got an EKG (immediately upon arrival), two chest X-rays, two blood tests, and two doctor consults (one to talk about the issue & examine me, another to talk about the test results & discharge). I left w/ orders to rest and a very fancy prescription for tylenol
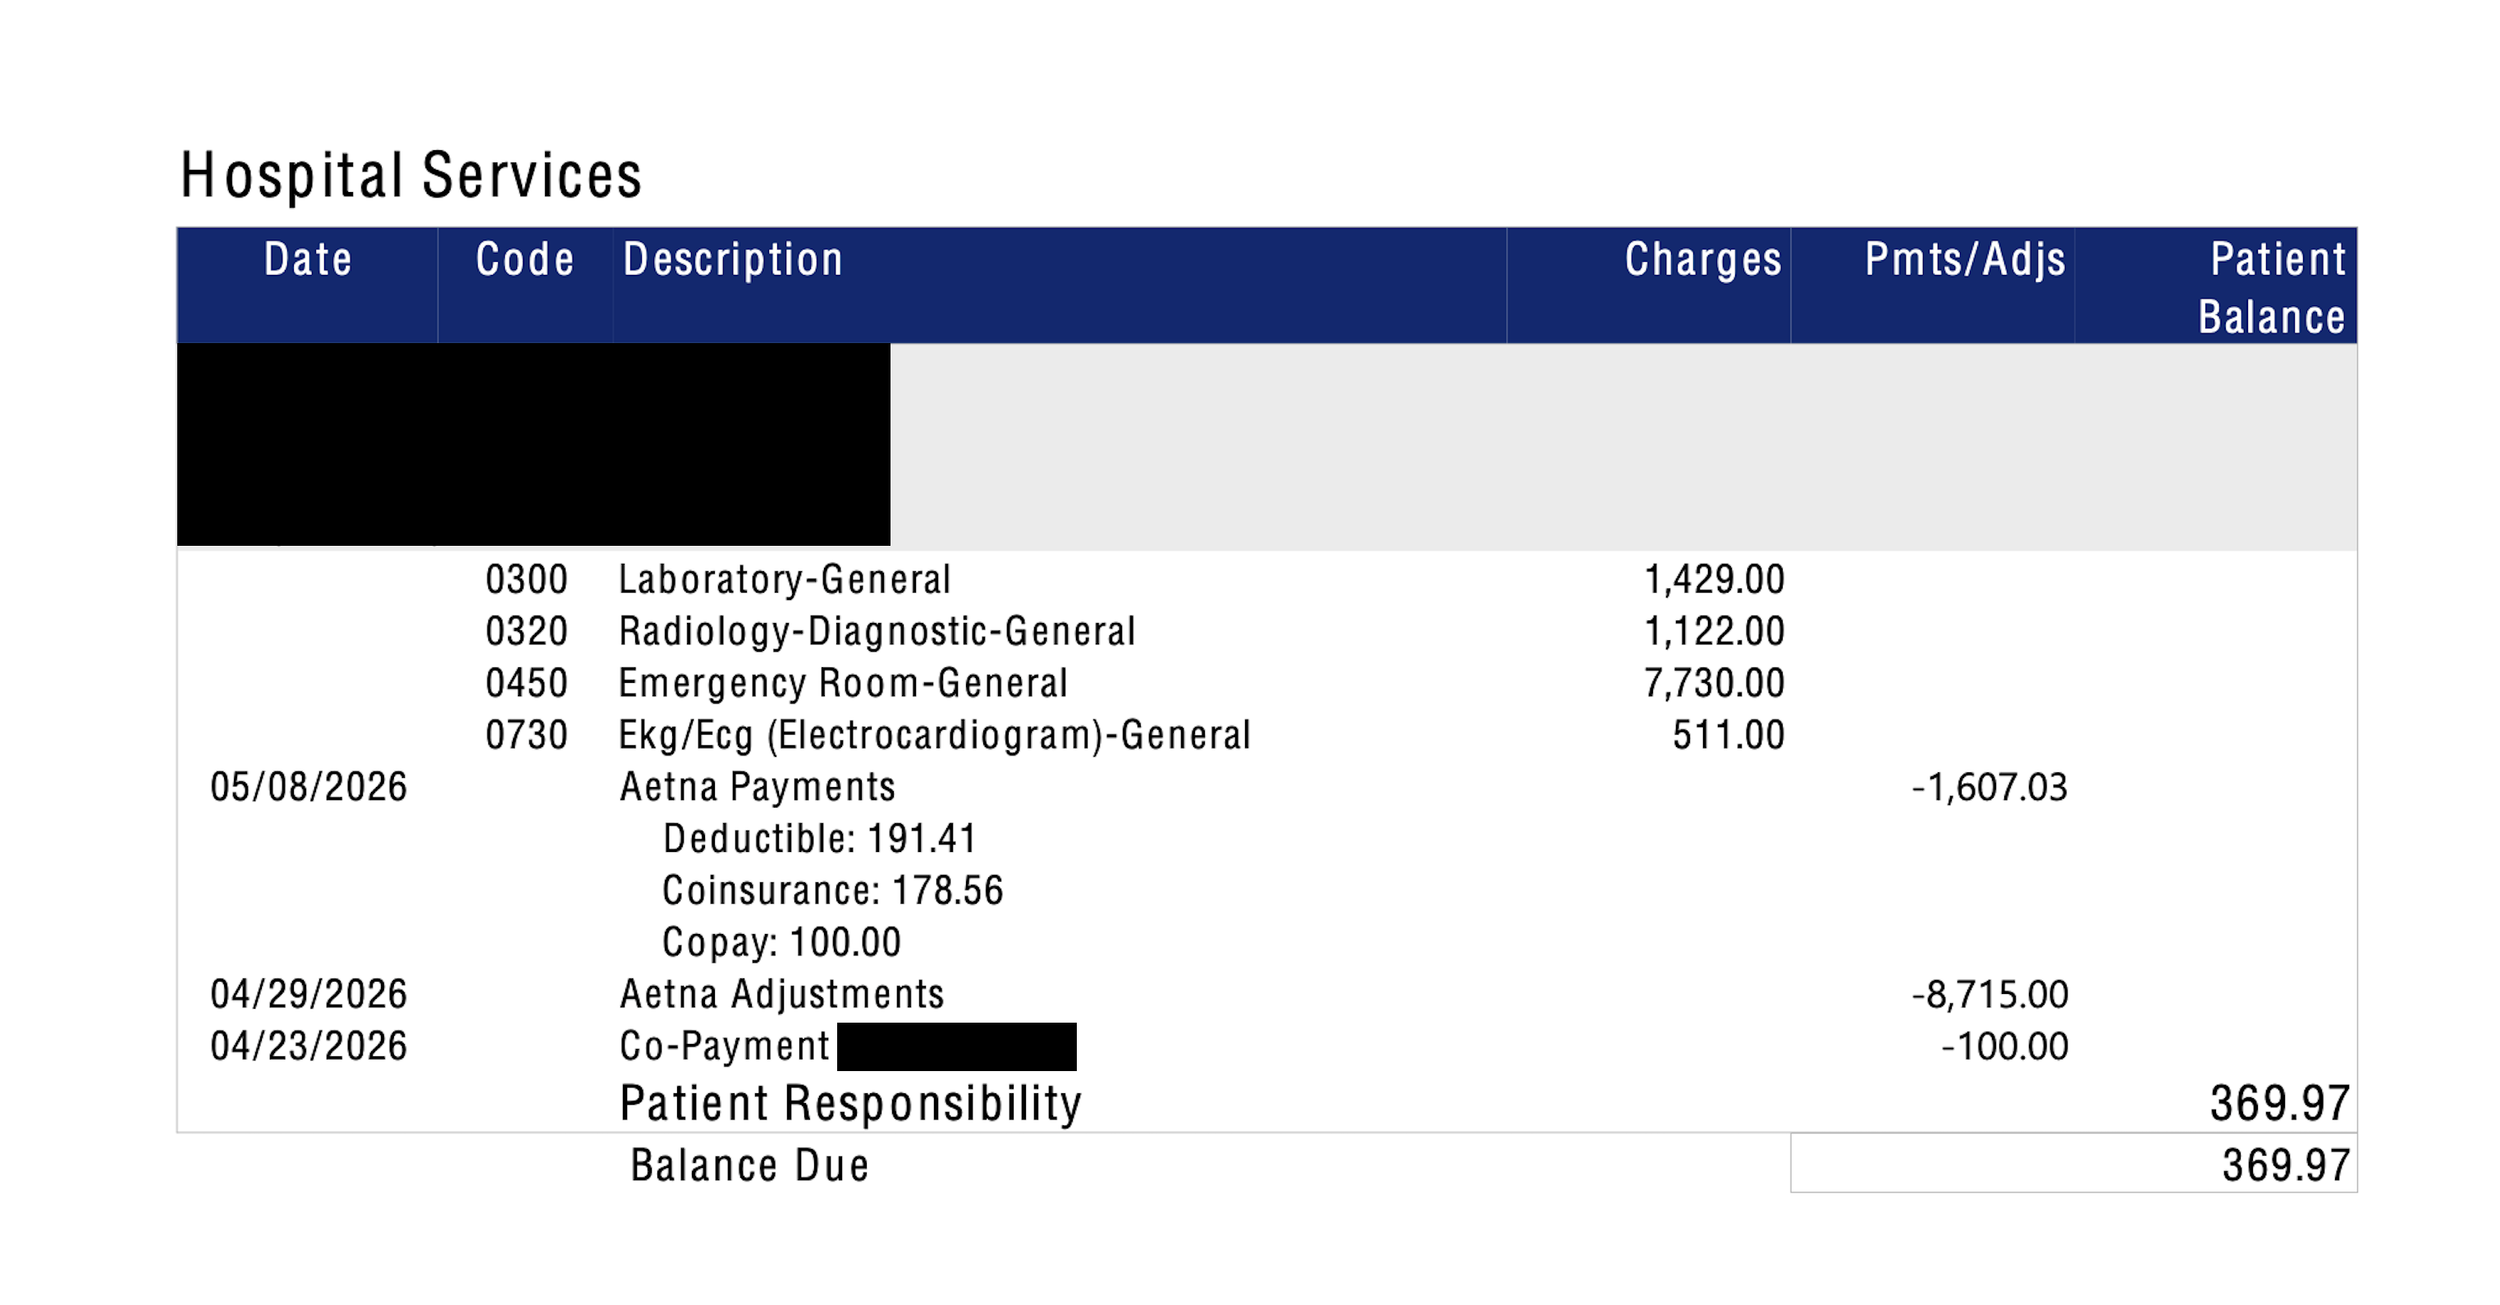
The hospital later quoted all that at an astounding $11,000. Breaking it down further:
$1,429 for the blood tests (~$710 per test)
$1,122 for the X-rays (~$560 per scan)
$511 for the EKG
$7,730 for the visit (i.e. ~$2,500 / hr since I spent 30 min in the waiting area)
I want to be clear, I’m sharing the #s here not to complain but for the sake of transparency b/c none of these costs are stated prior to treatment. I’m very happy I went and got checked out, the whole team of doctors, nurses, and administrators were incredible. Now what happens after the $11k quote? Well, Aetna quickly talks the hospital down to ~$2,000. That’s a $9,000 “adjustment” ie. an 80% discount. I have no idea how or why this happens. Can someone without insurance obtain such a steep discount / bargain on behalf of themselves? Not sure, but somehow I doubt it. Anyway, of that negotiated ~$2,000 charge, I then pay ~$500 in total which includes a $100 copay I made while I was there (essentially, the price of ER admission). Now, my insurance plan specifies that I only have to pay 10% of the final cost (I told you, it’s a decent plan). However, w/ copays & deductibles (methods of offloading some of the cost back onto the insured individual for one-off visits, which I’m not claiming is justified), I end up paying double that (~20% of the total bill) while Aetna pays the rest (~80% i.e. ~$1600).
Really weird system all around. Note(1) that my deductible ($200) is quite low, many plans require you to pay $1,000+ out of pocket before insurance kicks in. Note(2), it took ~3 weeks to get a bill from the hospital b/c of the negotiations taking place behind the scenes. During that time, Aetna provided oxymoronically named “Explanation of Benefits” (EOBs) to me which are documents that give early previews of what the bill will be after negotiation i.e. what insurance has agreed to pay and what they haven’t and what charges are expected to fall on me. Those EOBs are honestly quite disturbing because they list each charge and then point out how your insurance plan doesn’t cover them in full. They really should be called Explanation of Deceits. To wrap up, I want to reiterate (1) I’m happy I went (2) $500 is manageable ($11k is not) (3) the ER team was awesome (4) I appreciate my health insurance and (5) the system is whack.
Radiology Associates
Emergency Physicians Associates
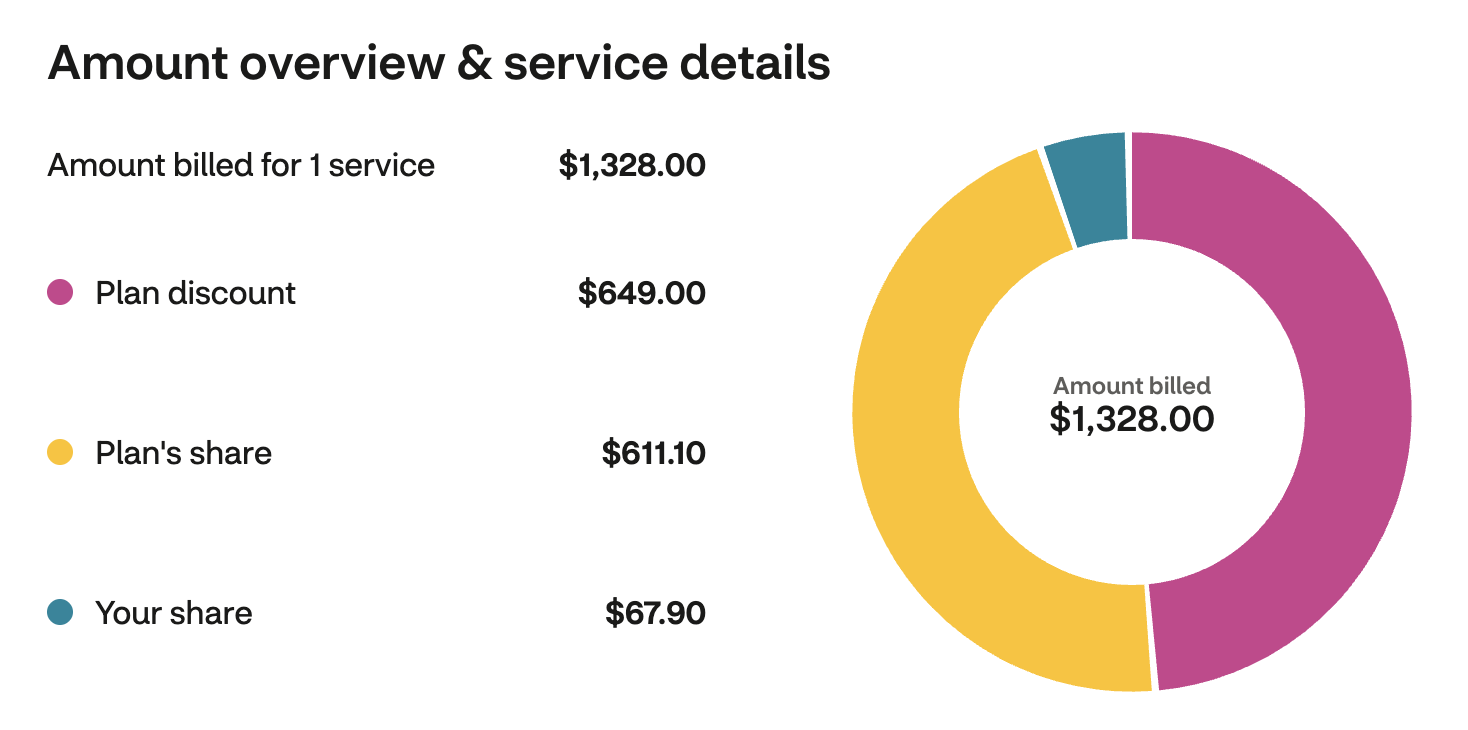
This charge high, negotiate down pricing scheme seems extremely exploitative, especially if patients don’t have an established insurer to represent them & get the best discount. Also, I understand in an emergency the priority is to help the patient, but literally no prices are shared w/ you before decisions are made so you are at the complete mercy of what the hospital decides to charge afterwards & your (often highly nuanced) insurance plan.
UPDATE(2): I received 2 more bills from (self-contracted?) ER doctors/radiologists which were fortunately small and completely covered by insurance. Still, if I see one more email from Aetna exclaiming “ITS HERE: Your EOB statement is ready” as if I should be excited to receive more charges I’m going to scream. It’s truly death by a thousand (very slow & obscure) cuts.
Final 3-hour ER visit stats: 5 separate bills received across 2 months post visit totaling ~$2,850 (after negotiations) of which I personally had to pay $550 (19.2%)
Note that I didn’t accept an ambulance ride which would’ve added at least another $1,000 in personal costs (learned my lesson from a previous visit to the ER five years ago…)
Early ABS trends
It’s May 1st and, roughly one month into the MLB season, I’m loving the new review system. The early numbers are both cool and sensible, challenges are largely a coin-flip (50/50 upheld vs. overturned) with catchers having a better eye (61% overturn rate, n=997) than batters (46% overturn rate, n=890). Pitchers have largely been instructed not to challenge by management b/c they’re farthest away from the plate and most emotionally invested in the pitch. This is proven in the data comparing pitchers success (41% overturn rate, n=41) to catchers; two fielders who ultimately want the same outcome. Essentially, the closer to the plate you are, and the more directly you’re facing the incoming pitch, the better you’re going to be at discerning balls and strikes. Therefore, catchers > umpires > batters > pitchers in terms of accuracy.
One more interesting early trend is in the # of successful overturns AGAINST a team. So far, Yankees appear to be outliers. Fun one to try to interpret: are umpires implicitly favoring the Yankees with their initial calls leading to a higher rate of overturns on challenges or do opposing players just have an extra keen eye when playing the Yankees? Or, a bit of both?
Data is from baseballsavant.mlb.com, a fantastic dashboard / analytics blog of MLB stats
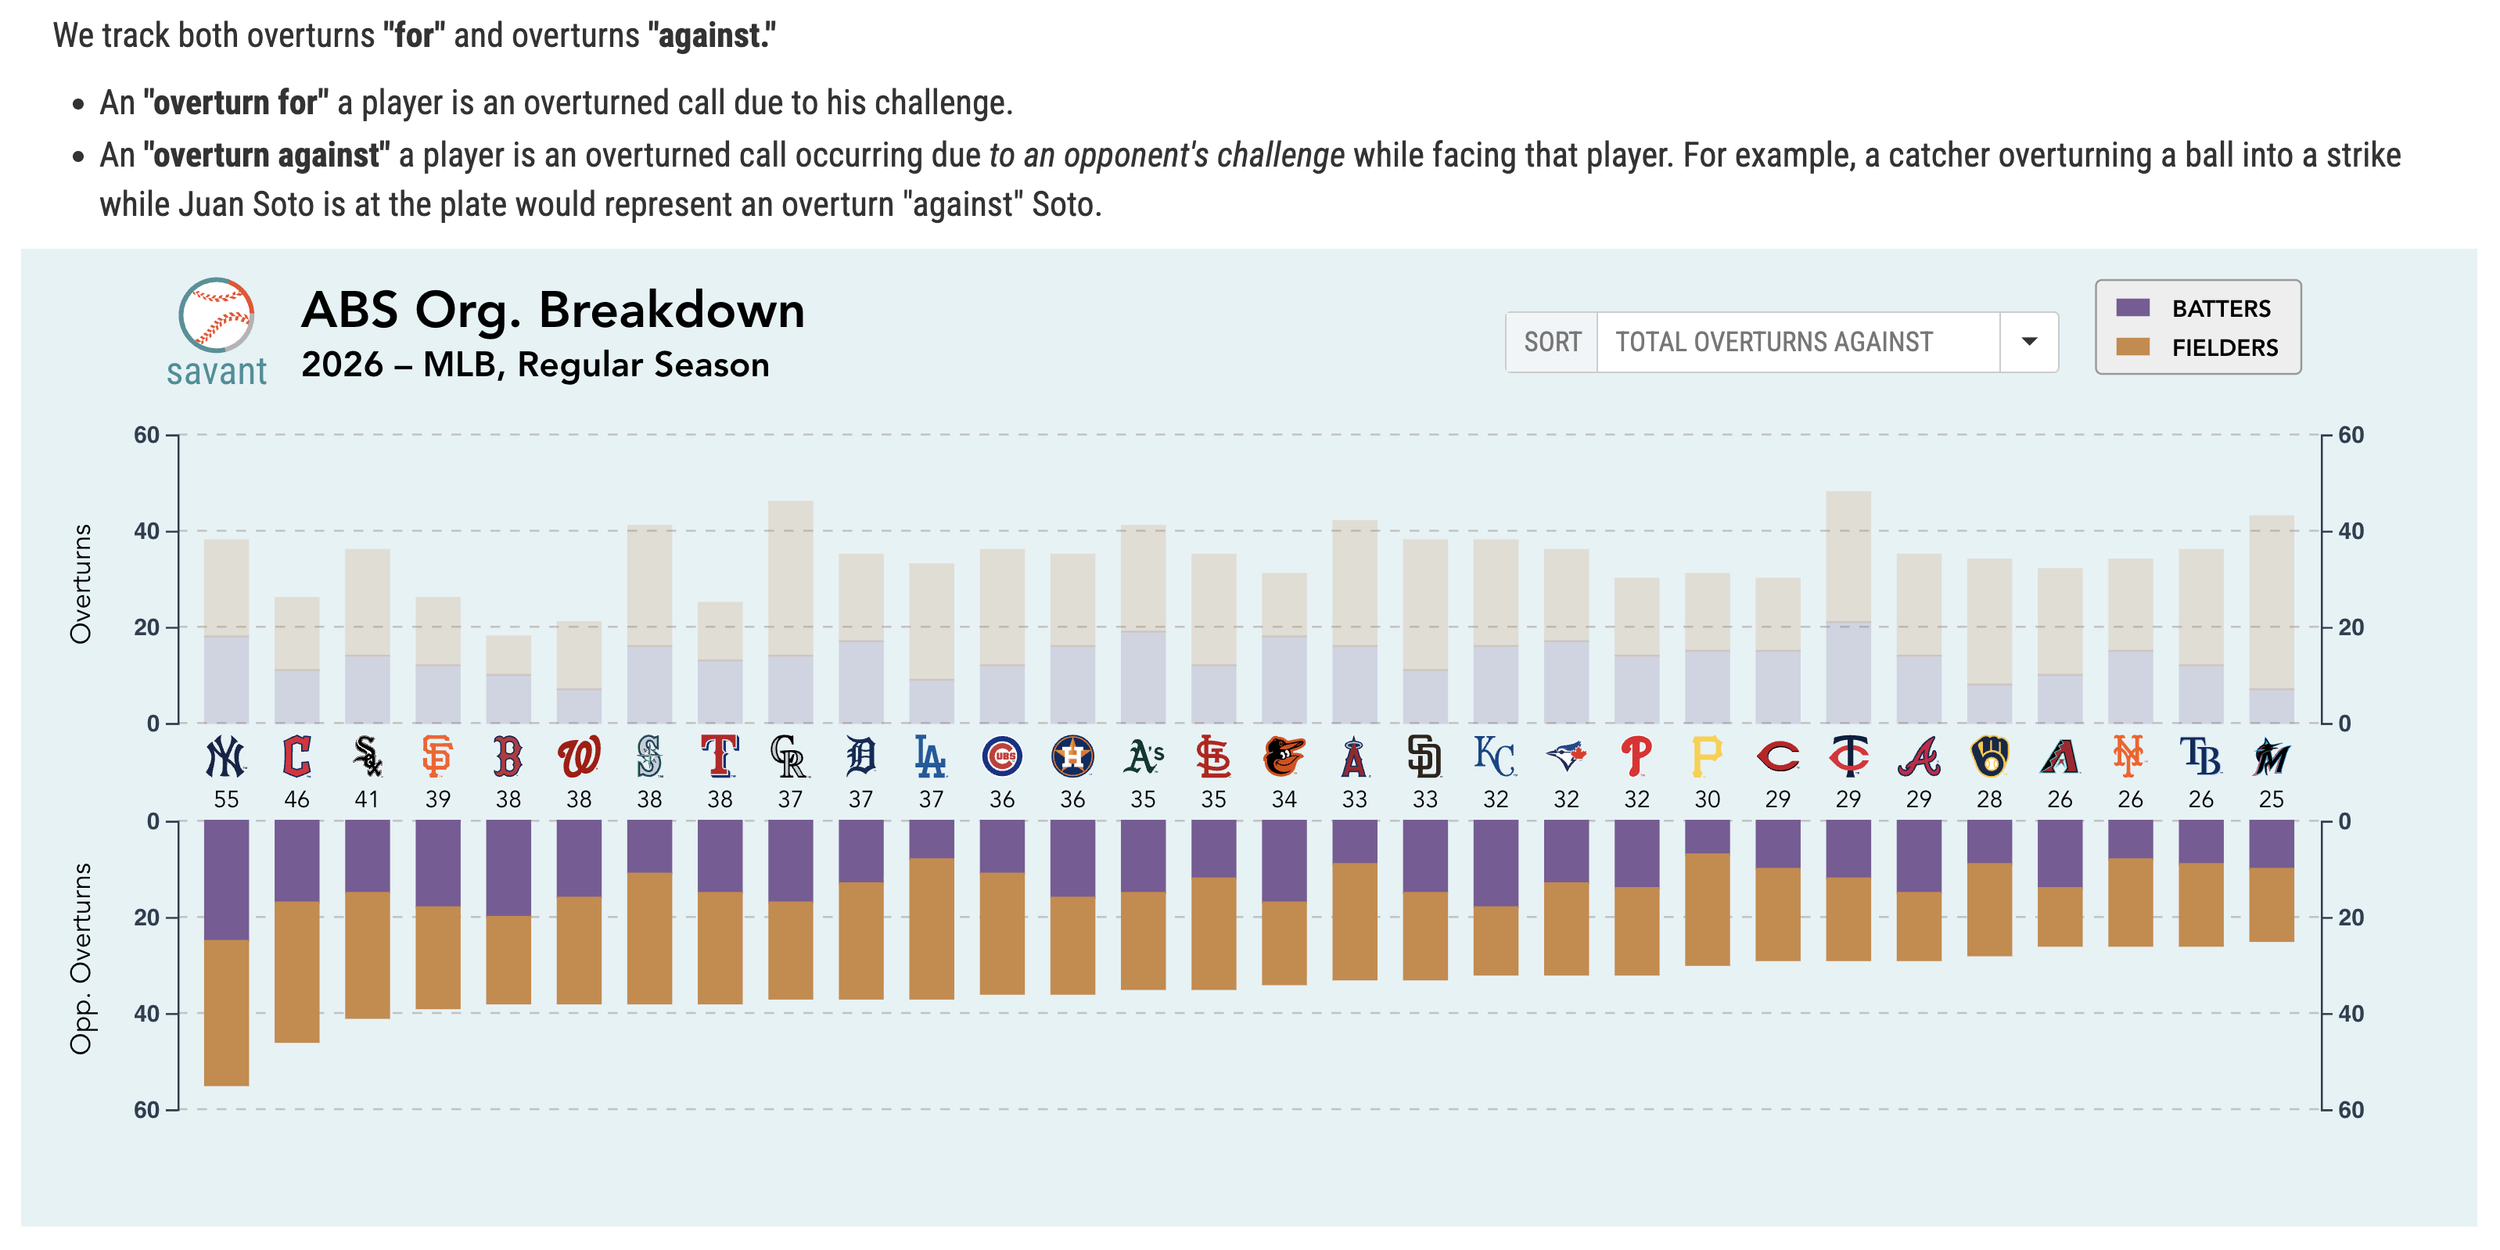
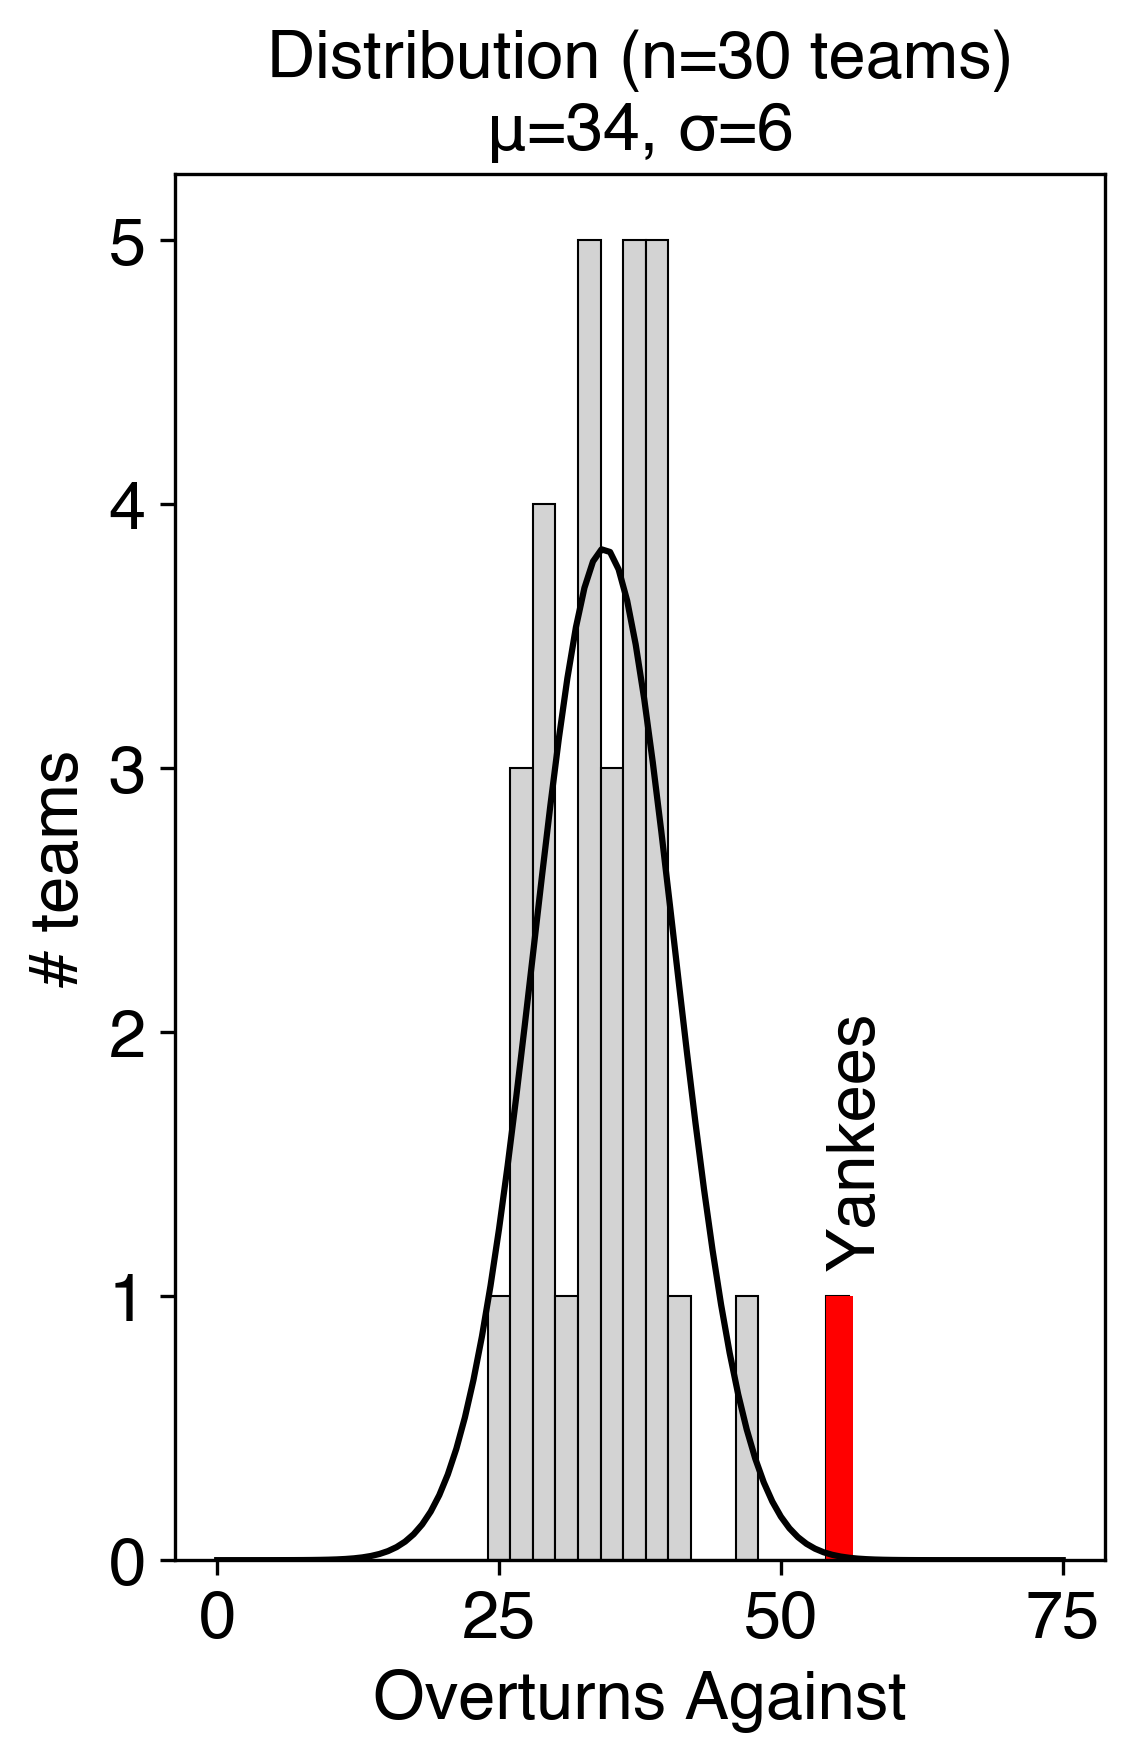
Other interpretations welcomed. For example, perhaps Yankees have played more close games, necessitating more challenges? But even if challenges are used more it doesn’t guarantee their success (an overturn), especially w/ each team limited to two unsuccessful challenges. Another possible explanation is that they’ve just happened to play more games in the early season against teams who challenge well (e.g. the Twins & Rockies) which kinda flips my cause & effect. Hmm…
You are what you eat (salty)
Tracked everything I ate for a month to figure out my nutrition before I turn 30…
Larger squares outlined in green mark days I ran. Shaded red regions indicate when I was sick (twice in 1 month!) 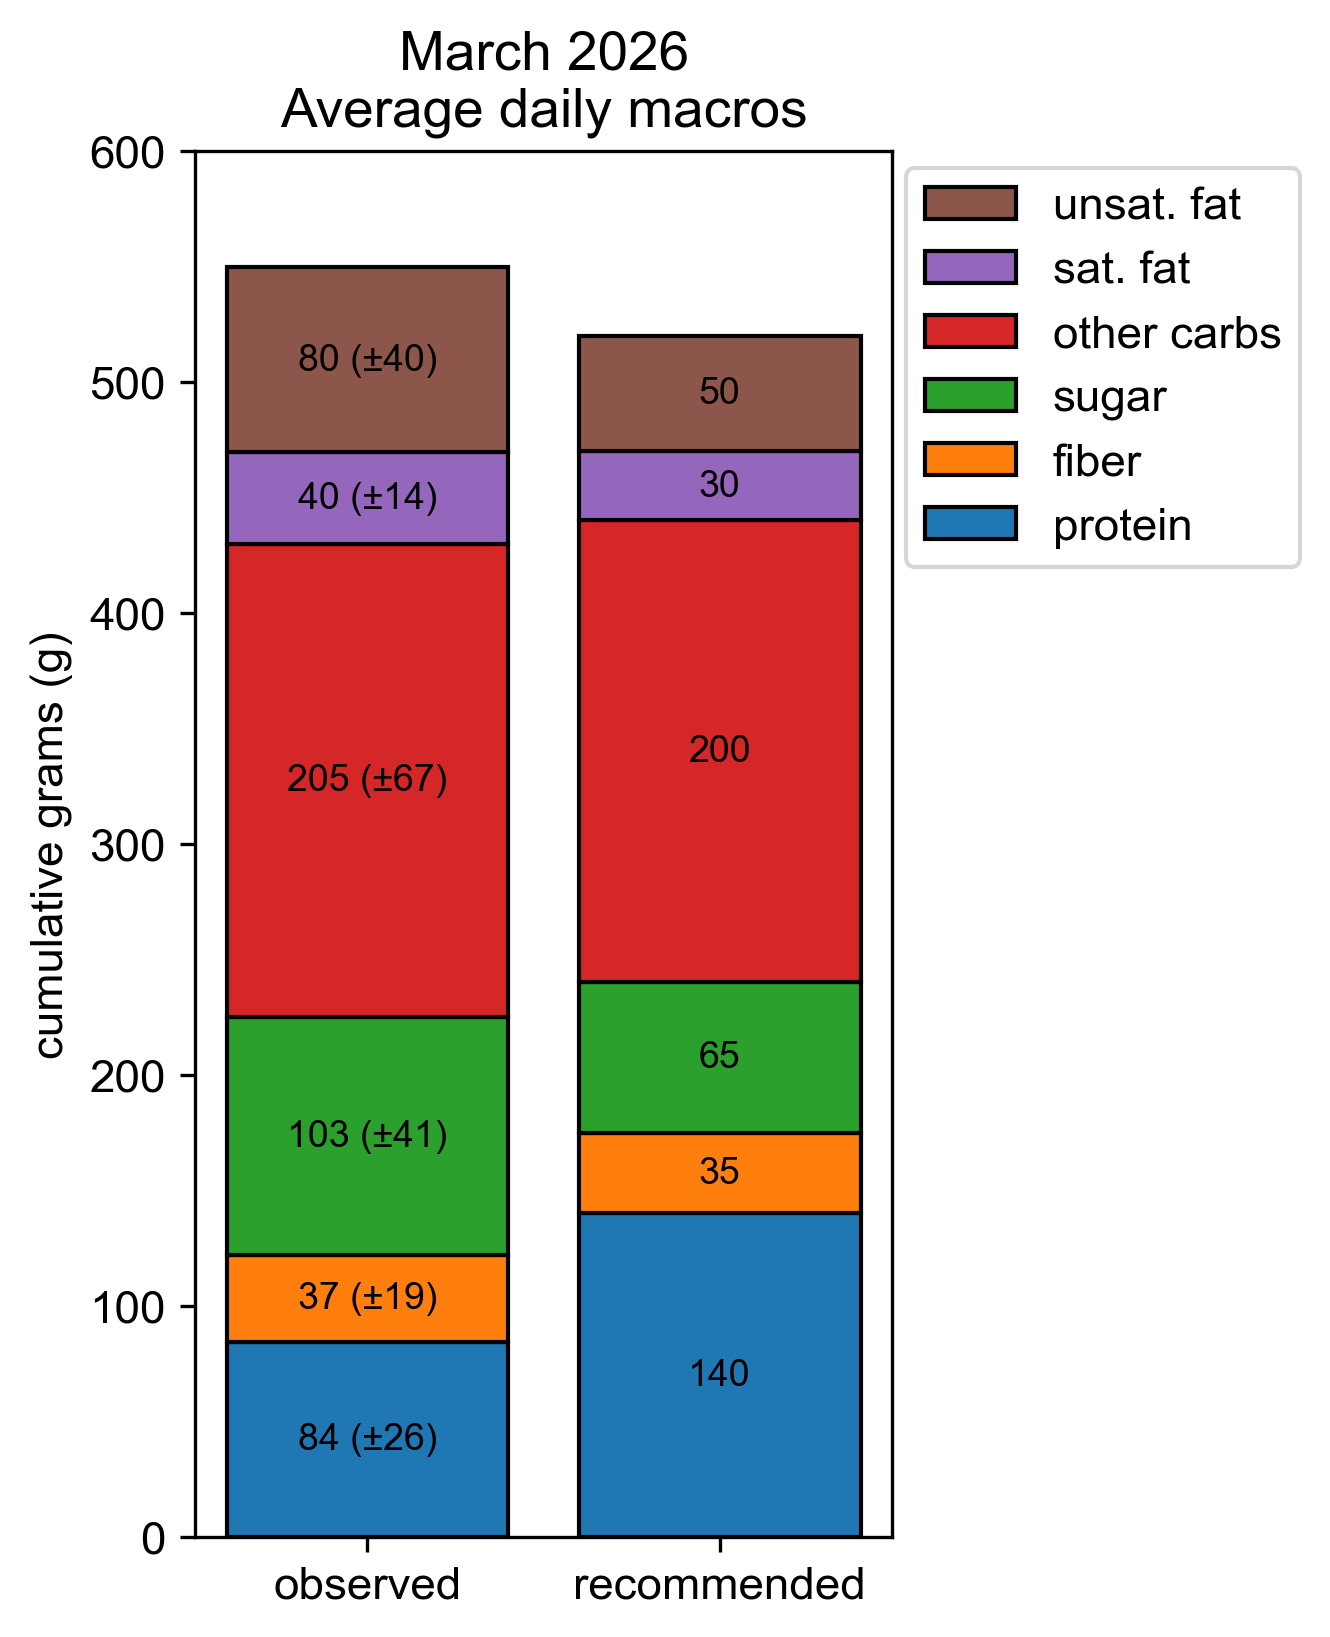
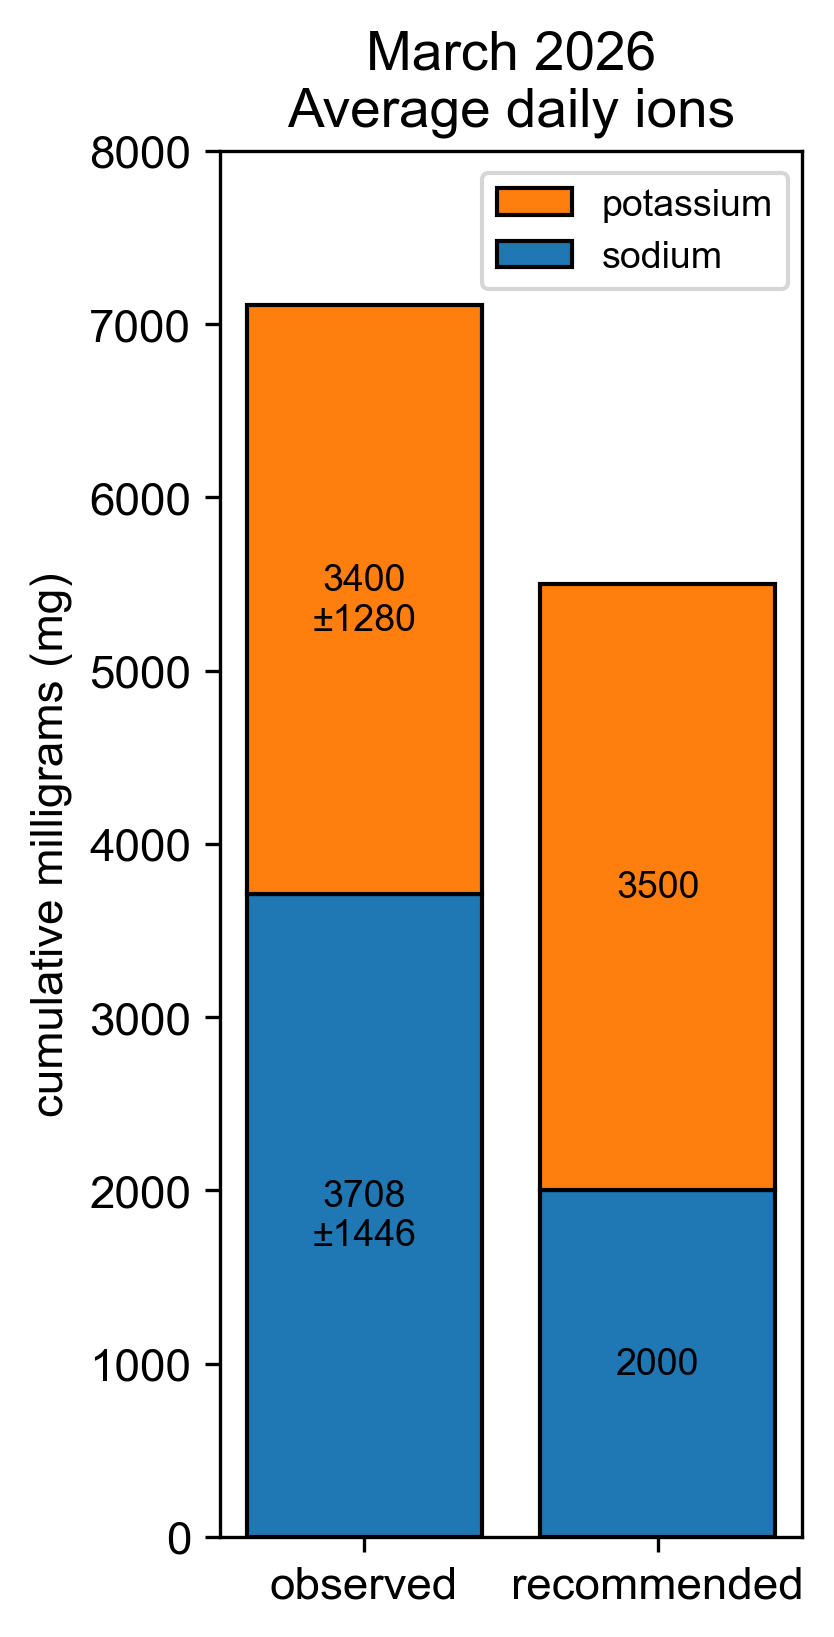
This was a fun one! Might continue for a couple more months since March was tough on my immune system and therefore my routine. Takeaways? I should halve my sugar intake and replace it with protein. Also I consume way too much salt. I’m getting the right amount of potassium (bananas & potatoes) but nearly twice the recommended sodium. Apparently the optimal potassium-to-sodium ratio is ~1.8 and I’m at ~0.9. Drinking more water would also help. Other observations…
550g = 1.2 lbs of food / day
Daily (categorical) nutrient intake is highly variable (CVs ~ 30-50%)
Actually lost 2-3lbs this month which proves the daily calorie target is a bit off
Definitely ate slightly healthier this month knowing everything was tracked (observer effect)
Also ate slightly more balanced because I could adjust to/compensate for my choices in real time (negative feedback)
For the 5000 calorie day, I ate very little, went on a run, then consumed ½ party tray of loaded nachos (K+/Na+ that day were near 8000 mg each)
140g of protein per day is really difficult. I’m hitting the minimum daily recommendation (70-80g) for my height/weight but apparently should be getting far more based on my age. I wonder if that’s skewed towards all the bodybuilders out there… Any day I ate >100g I felt very full and very heavy which made it hard to run. If I saved most of my protein intake until the end of the day then I definitely ate less the next day (will plot to prove once I have more data). TLDR: protein is filling…
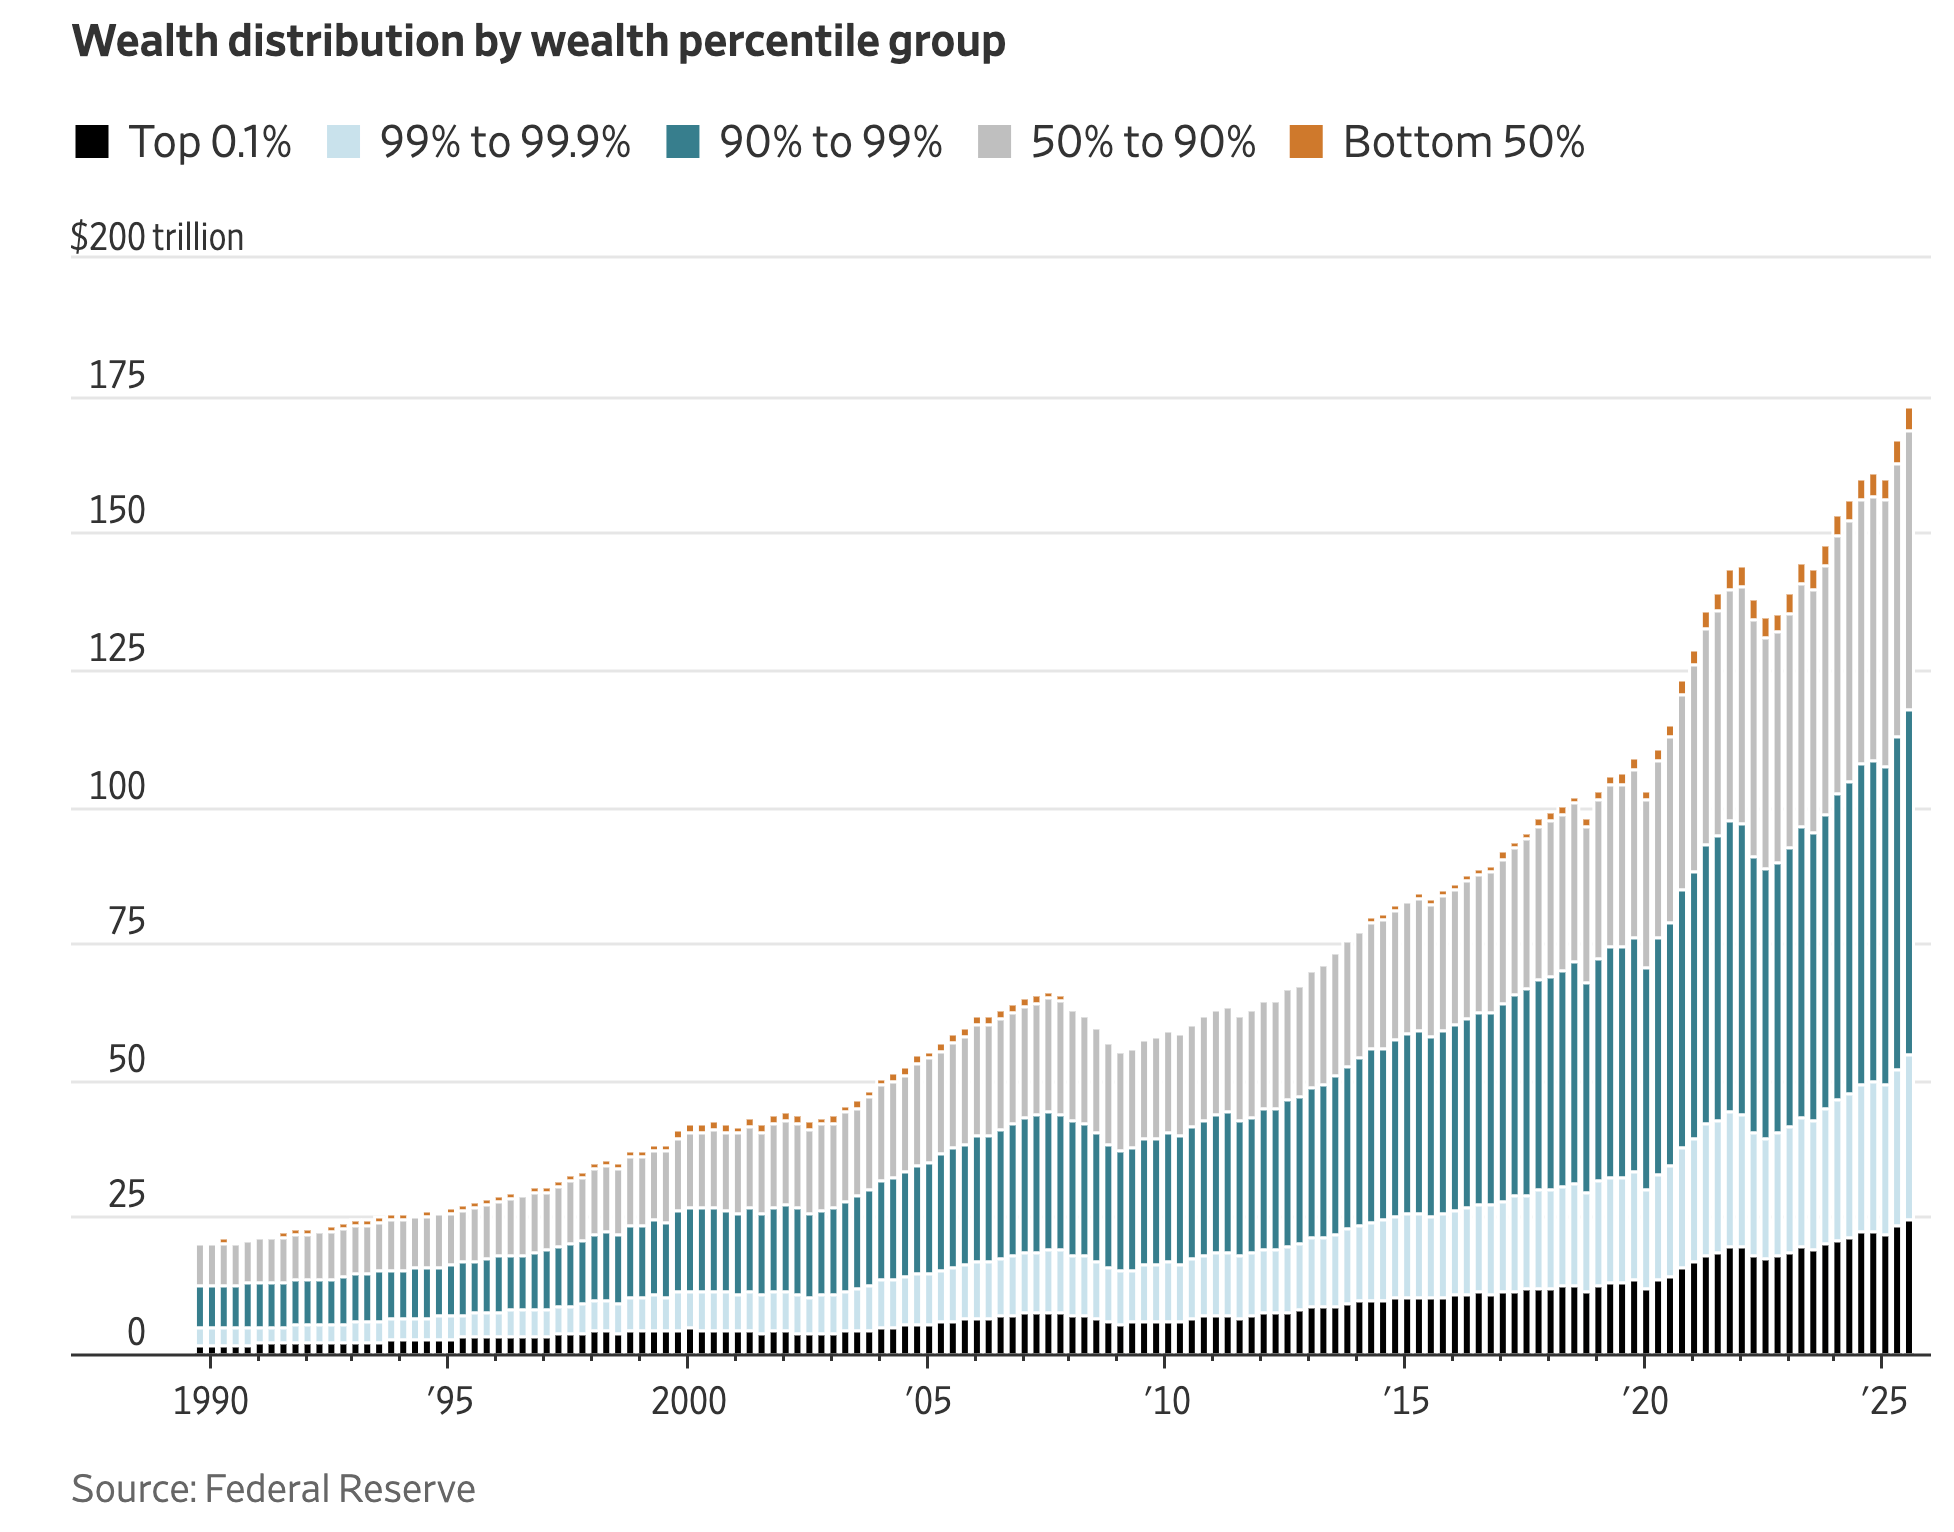
Despite the risk of my “Posts” page just becoming a regurgitation of the WSJ, I felt compelled to share this data summarizing the current state of U.S. socioeconomics
“Data from the Federal Reserve shows that only the richest 1% of households have grown their share of overall U.S. wealth since 1990.”
“…the bottom half of American households have lost ground. Their 2.5% cut of the country’s wealth has slipped from 3.5% in 1990.” - Yes, I had to re-read that as well
“One working paper by the National Bureau of Economic Research found that the effective tax rate for the U.S.’s 400 wealthiest individuals is 24%—compared with 45% for top labor income earners.” - mainly by borrowing against their assets b/c paying low interest rates to banks is way cheaper than paying income/capital gains taxes to the gov.
This “buy, borrow, die” strategy works b/c debt isn’t taxed (which is generally a good thing). However, when the debt isn’t real in the sense that it’s owed by an extremely wealthy individual and the stock they put up as collateral grows 7-10% annually while the loan’s interest rate is 3-5% then you’re just printing money. And don’t even get me started on basis resets (aka “step-ups”).
The K-shaped economy
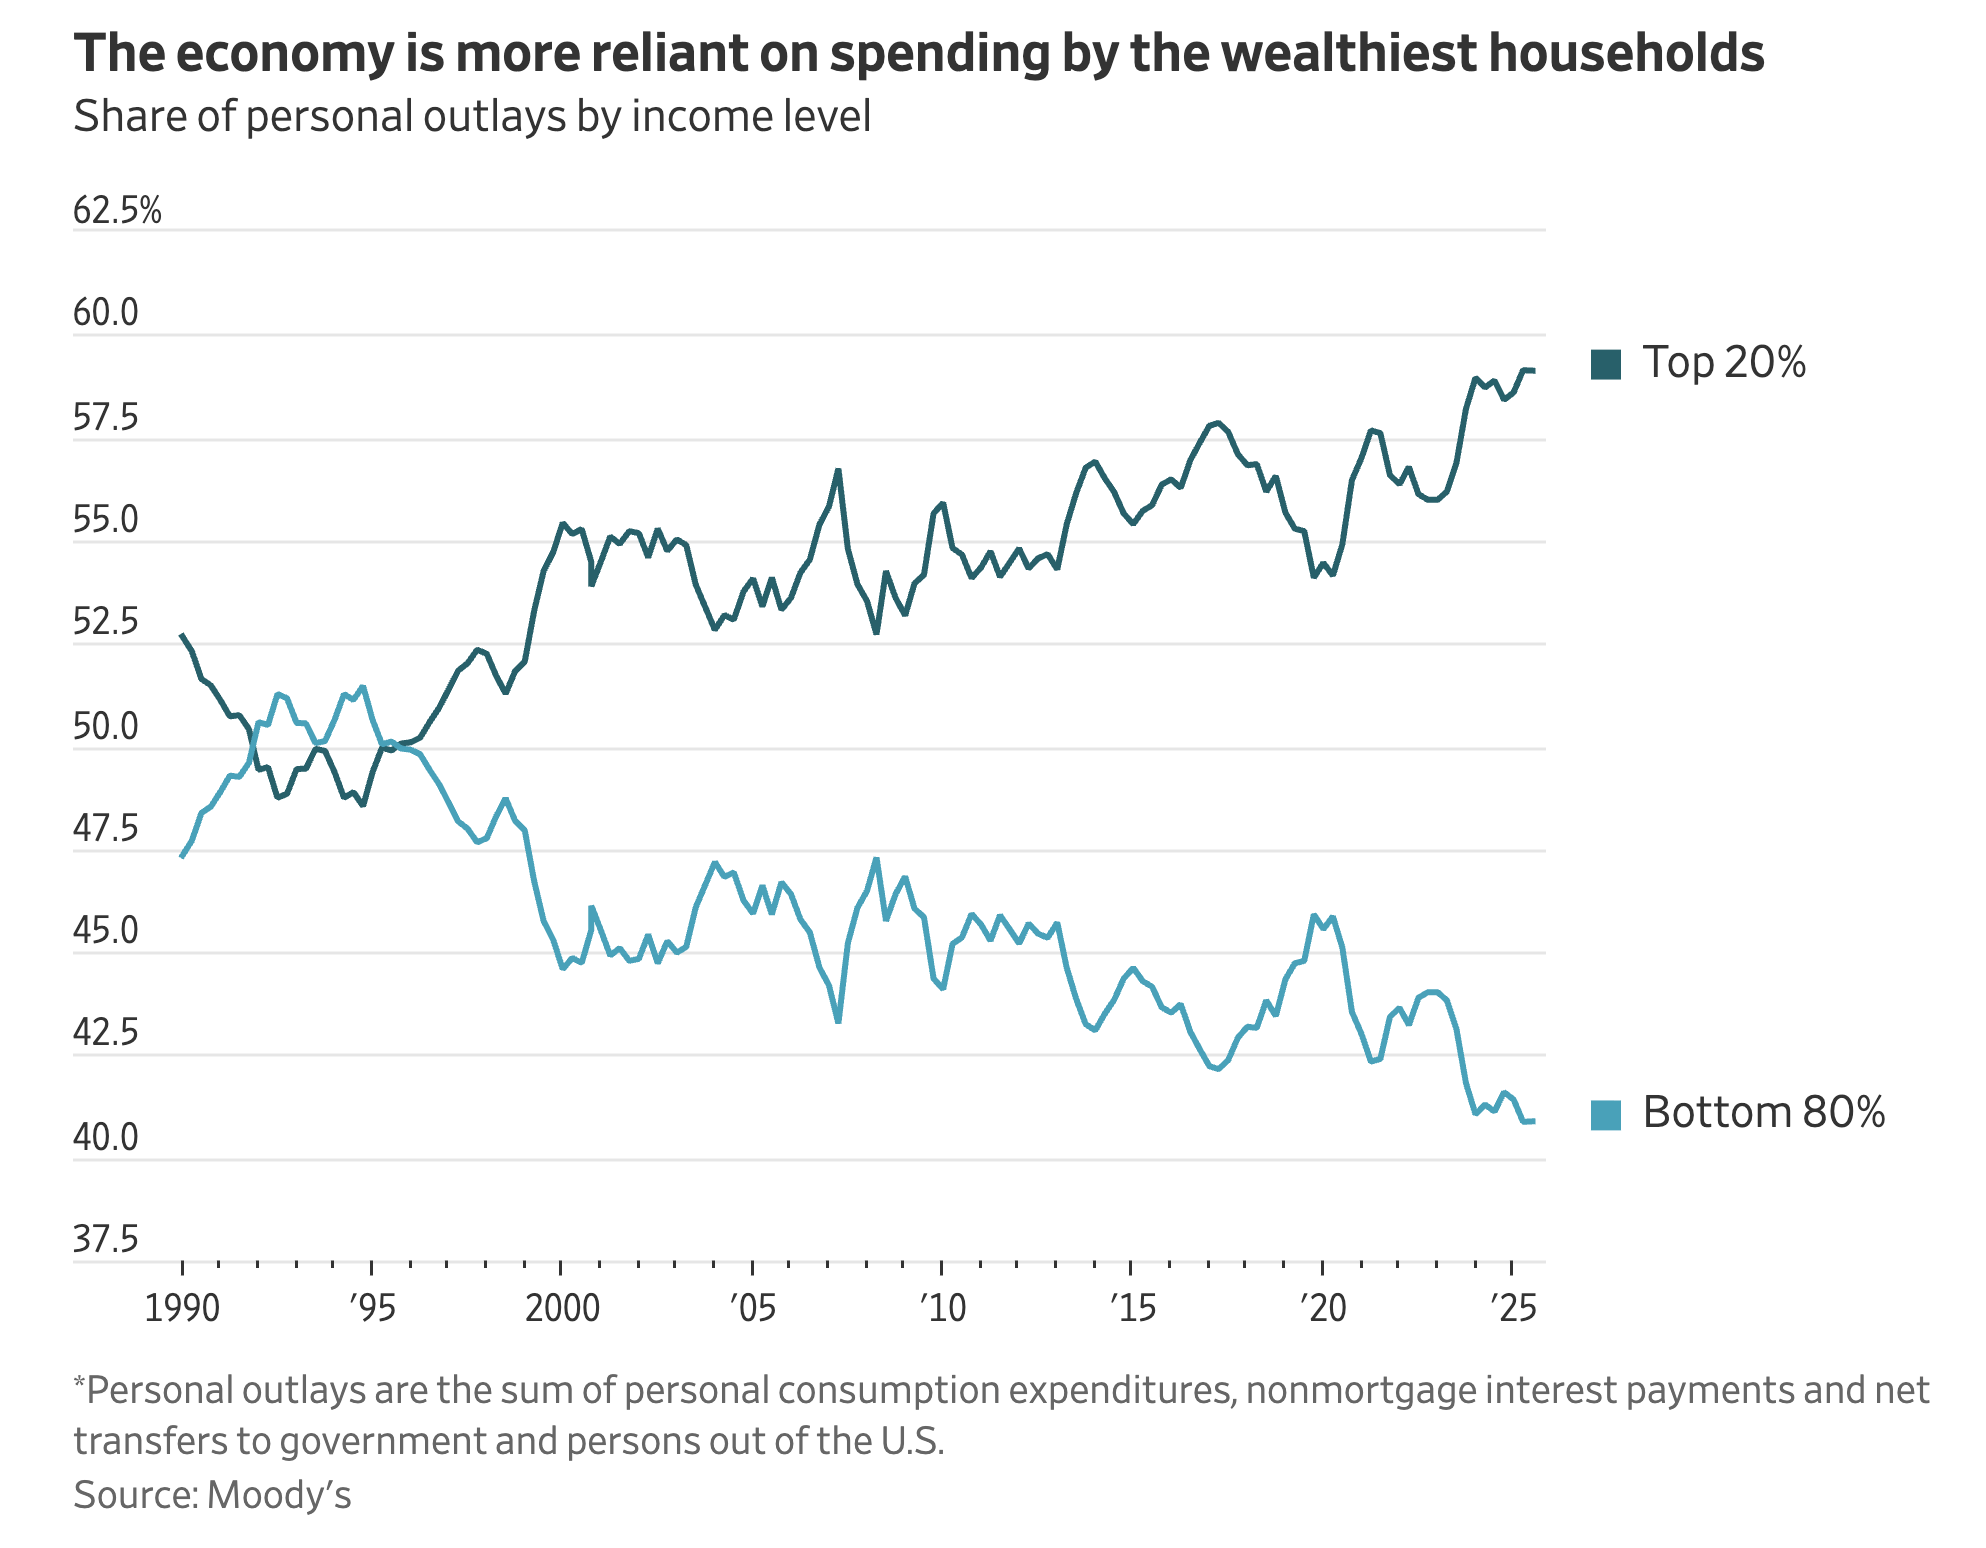
So we're living in a democracy that heavily benefits & caters to a wealthy few (who then use this advantaged position to influence policy)… that’s a plutocracy
Oof what a survey…
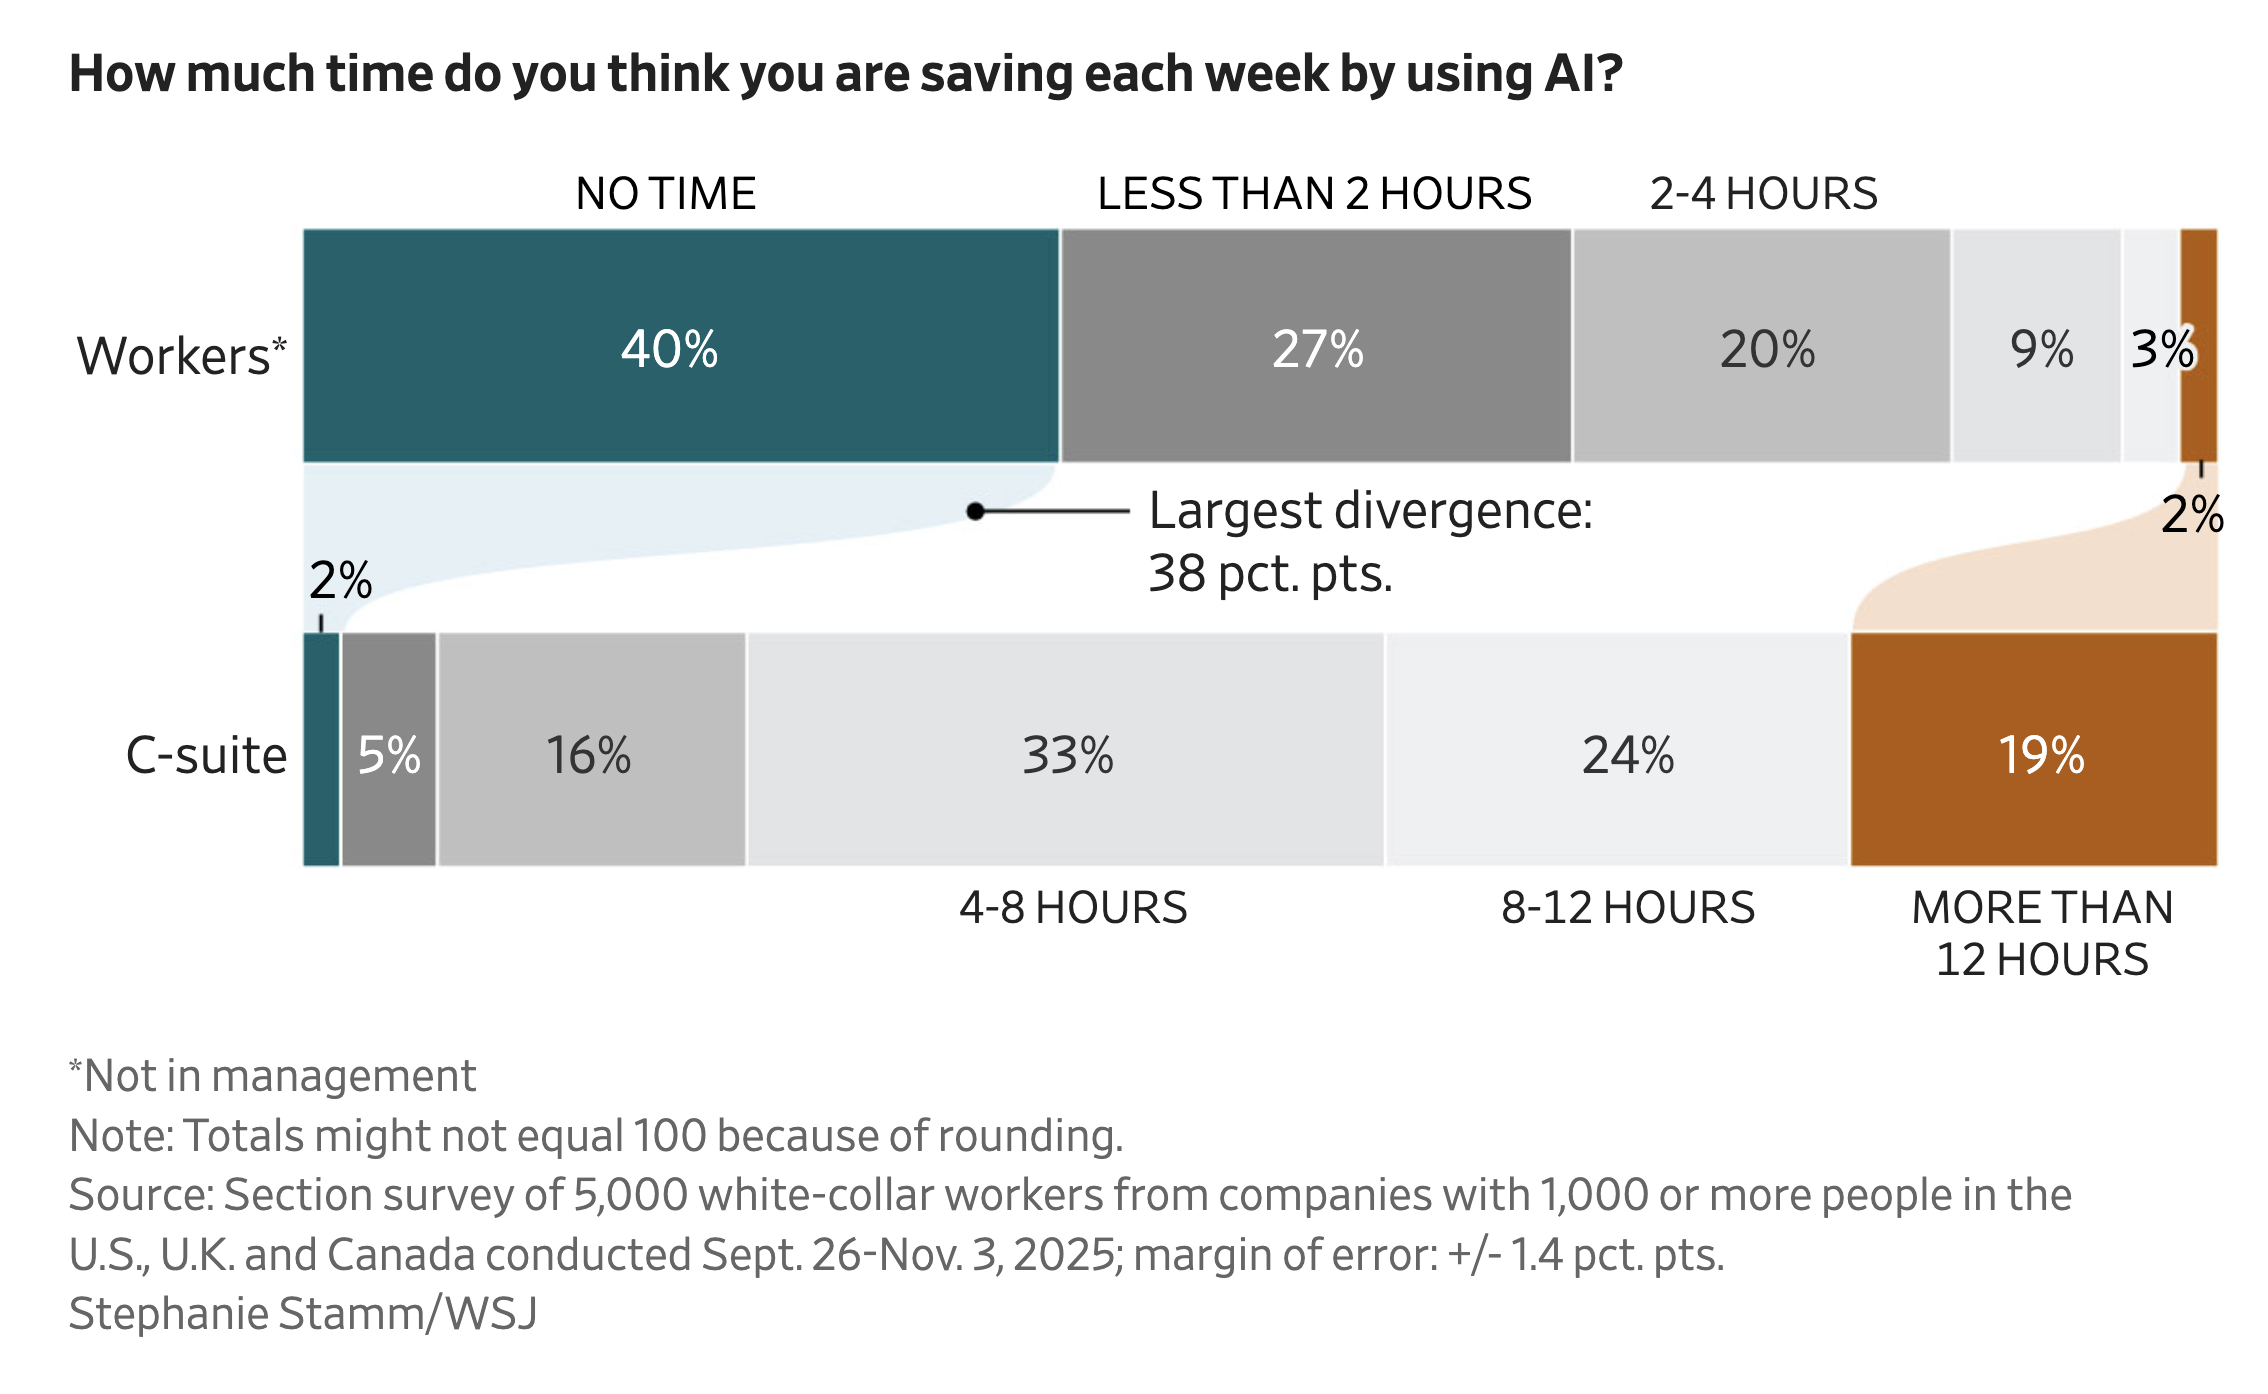
So many factors likely contributing to these splits… Also keep in mind this was conducted 2.5 months ago
Workers underestimating to maintain their jobs
C-suite overestimating to maintain theirs
C-suite more likely to have considerable personal investments in stock market (which AI hype is currently driving) i.e. asking the optimist (kinda the same as #2)
Workers busy with day-to-day operations, C-suite has more flexibility & motivation to test new tools (paid to be “forward thinking”) so they’ve been quicker to adaptation
C-suite efficiency gains are primarily b/c their work is heavily communications-based and LLMs are currently the best, most-tangible implementation of “AI” (a term I hate, btw)
Mirroring #5, workers are doing very-specific tasks for which models are not developed (not enough quality data or common interest) AND/OR accuracy & precision of work is prioritized and applicable models (non-linear, non-deterministic networks) are too erroneous.
Note: survey is normalized to white-collar workers (most similar to C-suite) but same holds for blue-collar workers, “AI” models just don’t matter/apply to many types of labor (until the robots rise…)
Weird way to slice the data WSJ… [0, 2, 4, 8, 12, 12+]?
Just make it even 4 hour increments and cut down on the # of grey shades we need to distinguish between…
Plenty of other takes, good and bad, I’m just surprised to see an order of magnitude difference at the two extremes between groups of employees… speaks to some kind of reality gap
Let’s talk antivirals
Did you know there are antiviral drug treatments available for the flu? For the longest time, I thought your only options were (1) prophylaxis via vaccine or (2) bear and suffer.
But no! Apparently, if protection by vaccine fails and you get infected w/ Influenza A/B (common flu), you can by prescribed one of two FDA approved antivirals, Tamiflu or Xofluza, that, if taken within 48 hours of symptoms appearing, will significantly reduce your misery (i.e. shorten the total time of your symptoms by 1-2 days). I had heard of Tamiflu before but for some reason thought it was just a tea that mildly relieved congestion (cc Roche marketing team). Nope, it’s an antiviral drug, as is Xofluza - a newer and arguably better drug with a different mechanism of action (inhibits a different viral protein) but works through fundamentally the same principle: preventing the virus from proliferating & spreading between cells in your body.
There are actually 4 FDA-approved flu antivirals, however the other two are not practical/popular. Zanamivir (Relenza) is taken as an inhaled powder, Peramivir (Rapivab) by single IV infusion. Both are neuraminidase inhibitors
Gilead developed oseltamivir (Tamiflu) in early 90s and licensed to Roche in 1996. They collaborated on clinical trials for 2.5 years before the drug earned FDA approval in 1999. Patents now expired so produced generically
Shionogi & Co (a Japenese company) developed baloxavir (Xofluza) and licensed to Roche/Genentech circa 2018, earning FDA approval in 2020. Note: Roche acquired Genentech in big 2009 merger

Oseltamivir (Tamiflu)
Oseltamivir acid (active form)
Influenza genome structure is whack, consisting of 8 separate segments of (negative sense) ssRNA each wrapped around a bunch of protein & capped w/ a polymerase complex. This highly segmented structure is one reason why the virus is so adaptable as it can re-arrange a bunch of ways.
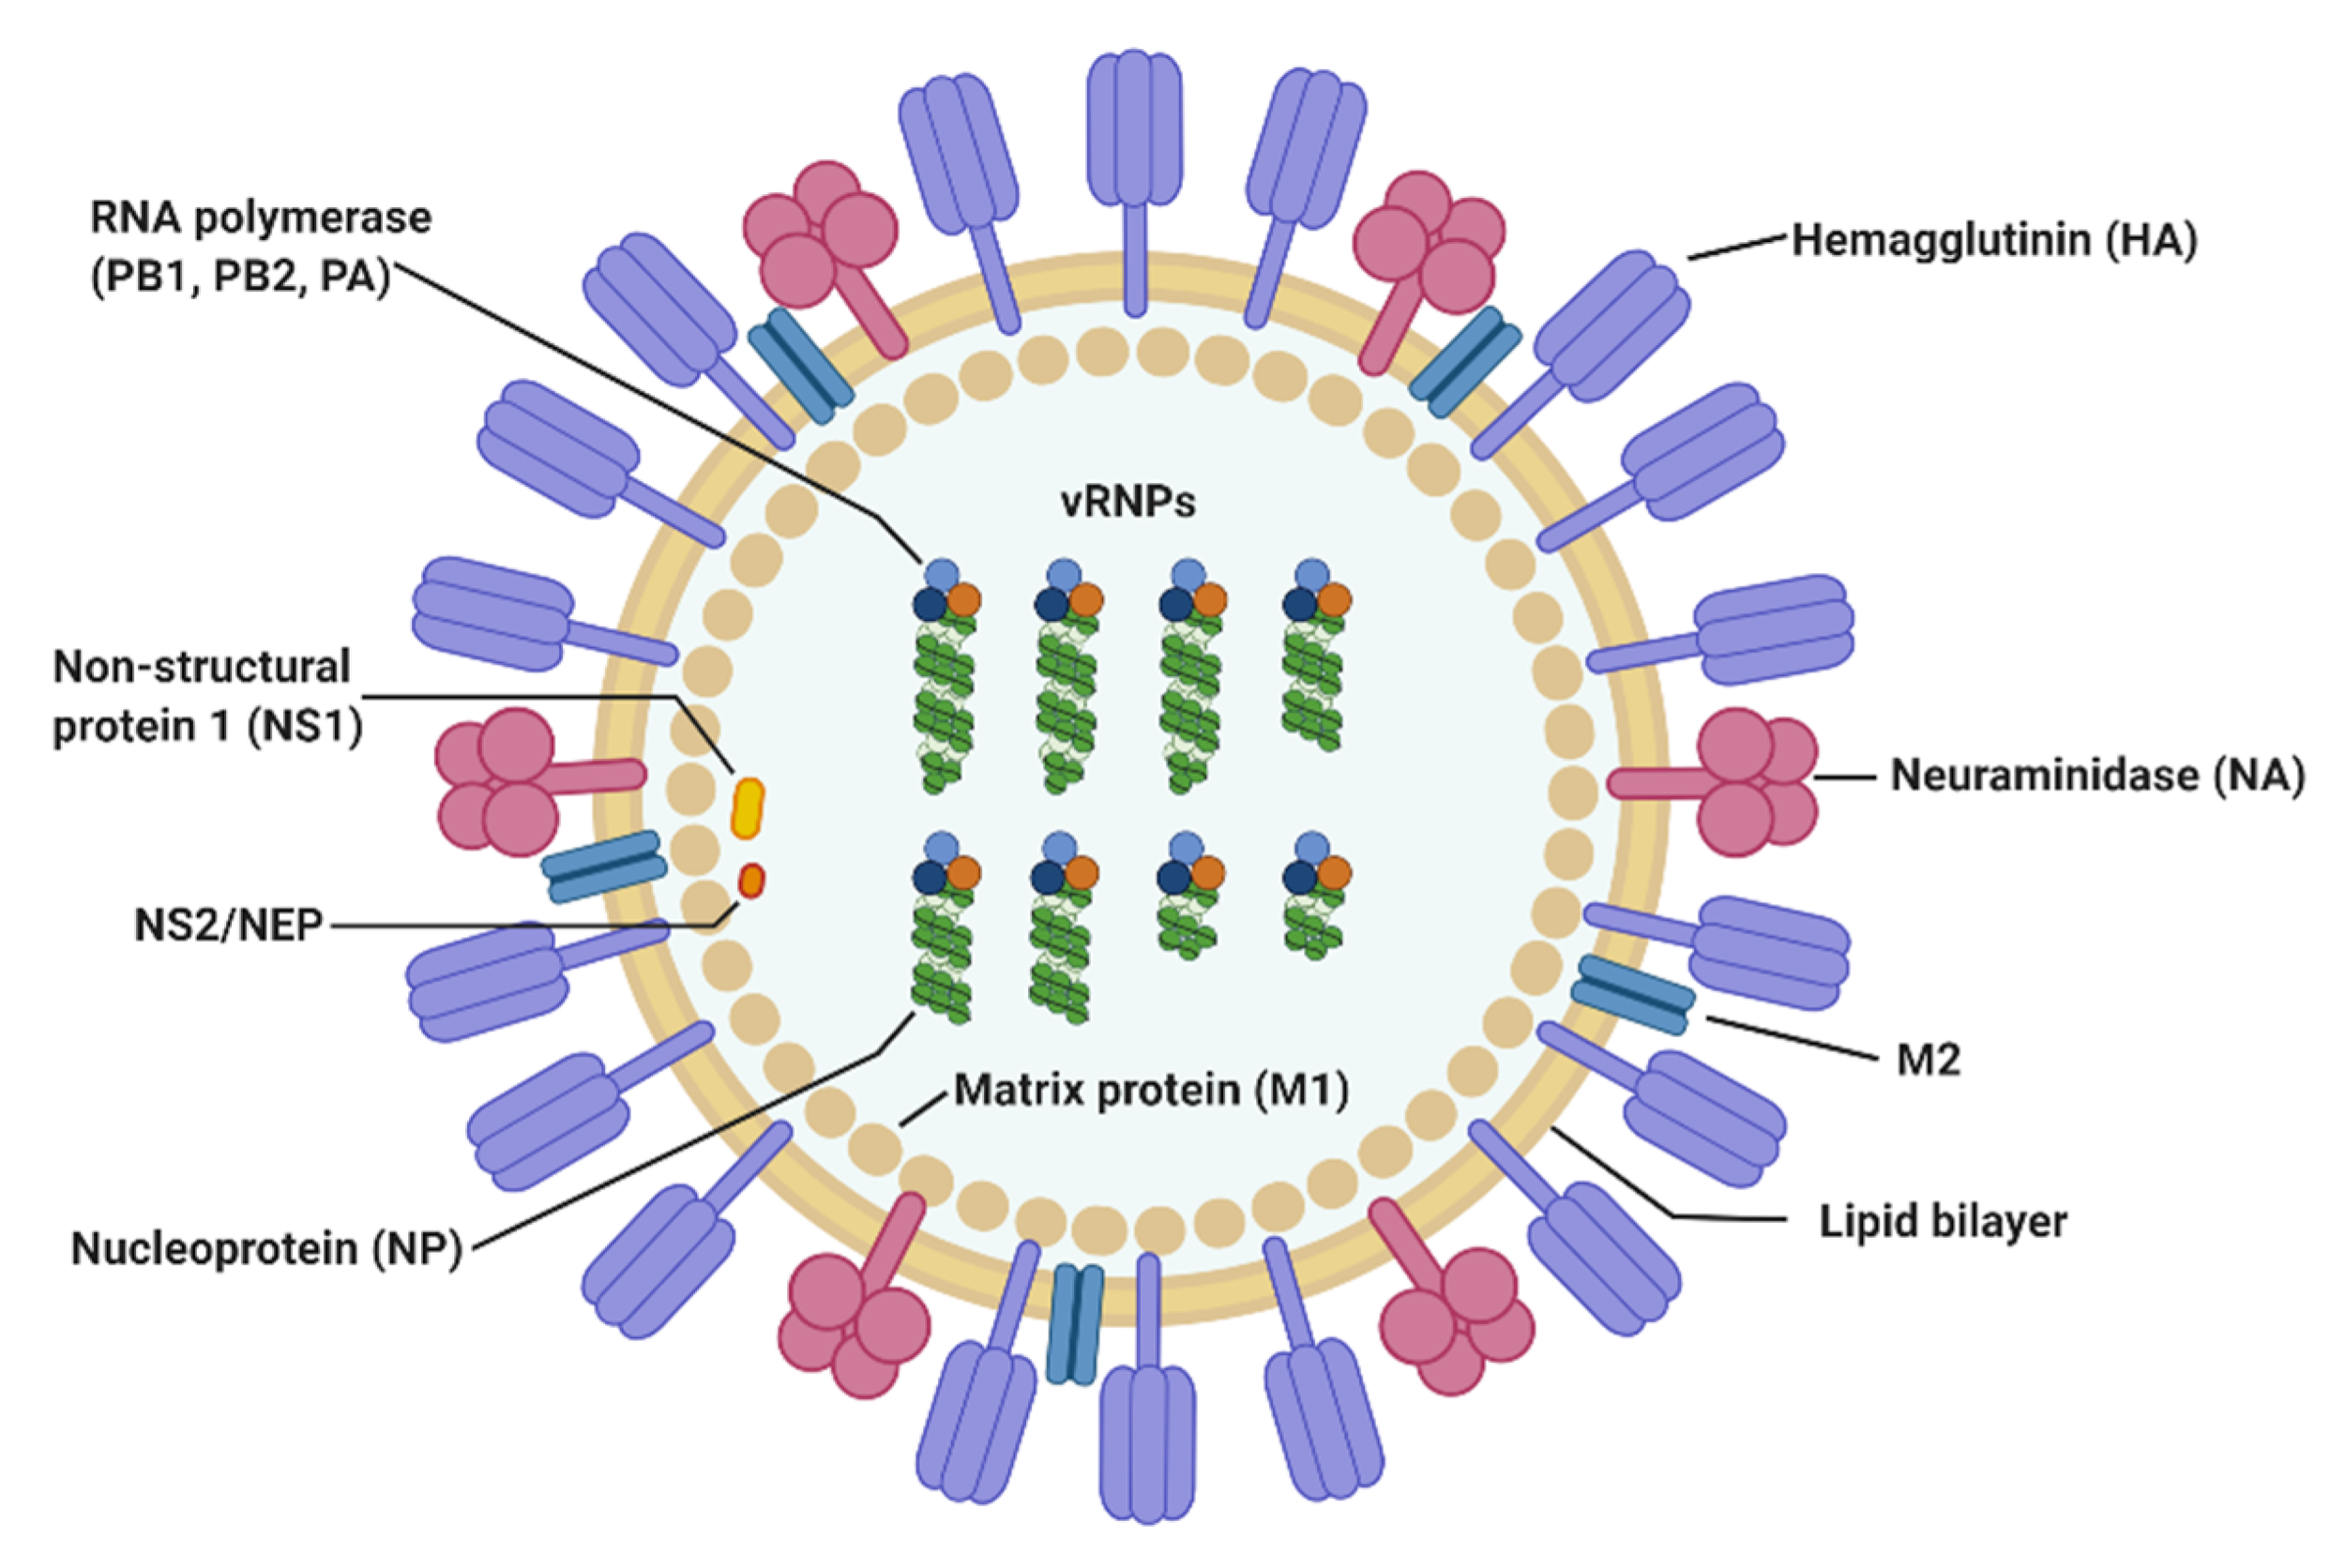
Image by Hi Eun Jung & Heung Kyu Lee
Baloxavir marboxil (Xofluza)

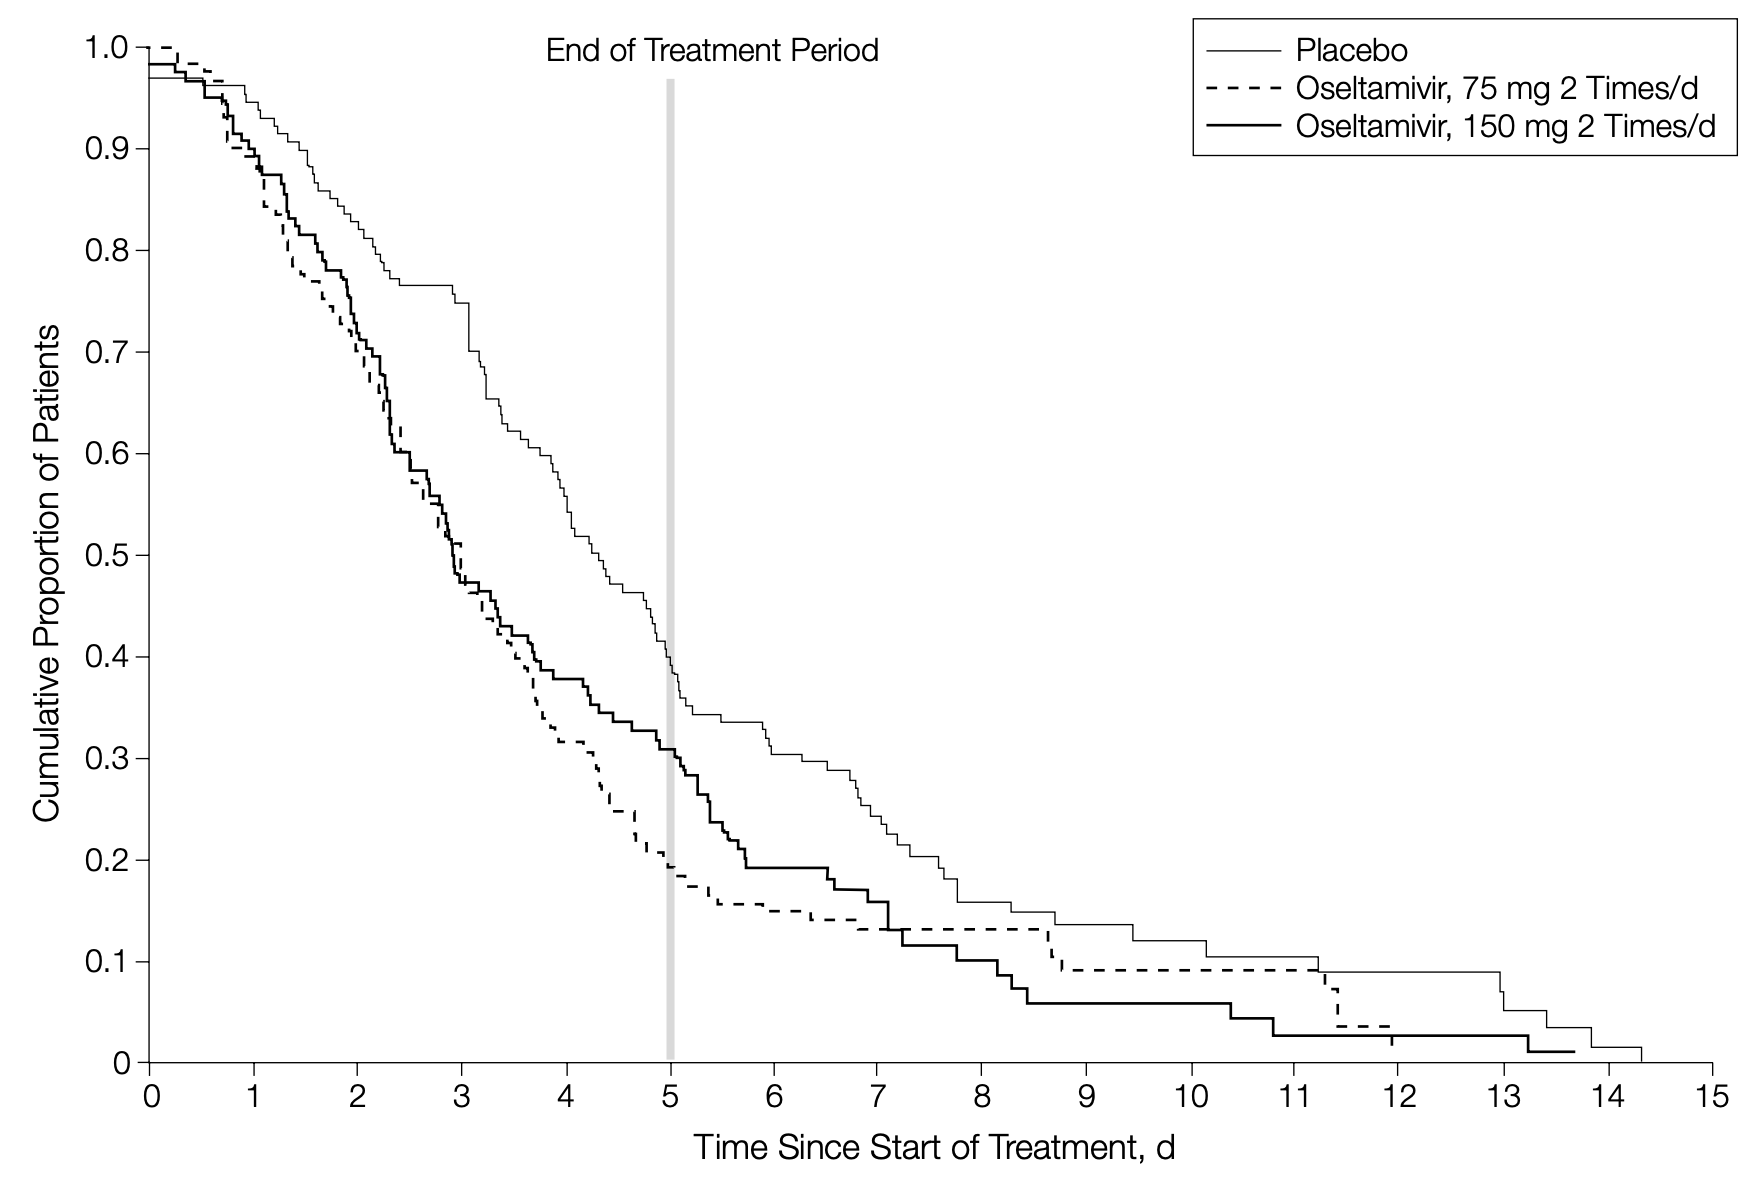
Oseltamivir trial results (2000): Kaplan-Meier curve
Baloxavir acid (active form)

Oseltamivir inhibits the viral neuraminidase (NA) protein which sits on the surface of the virion and aids in release from the host cell as newly formed virions bud off the host membrane
Baloxavir inhibits the the cap-dependent endonuclease domain of the viral polymerase acidic (PA) protein to prevent viral genome replication after the virus has entered the host nucleus
This is actually a wild thing that influenza does, cleaving the 5’ end off mature host mRNA to use as a m7G-capped primer to transcribe positive sense viral RNA (vRNA) which the host then translates thinking it’s normal mRNA
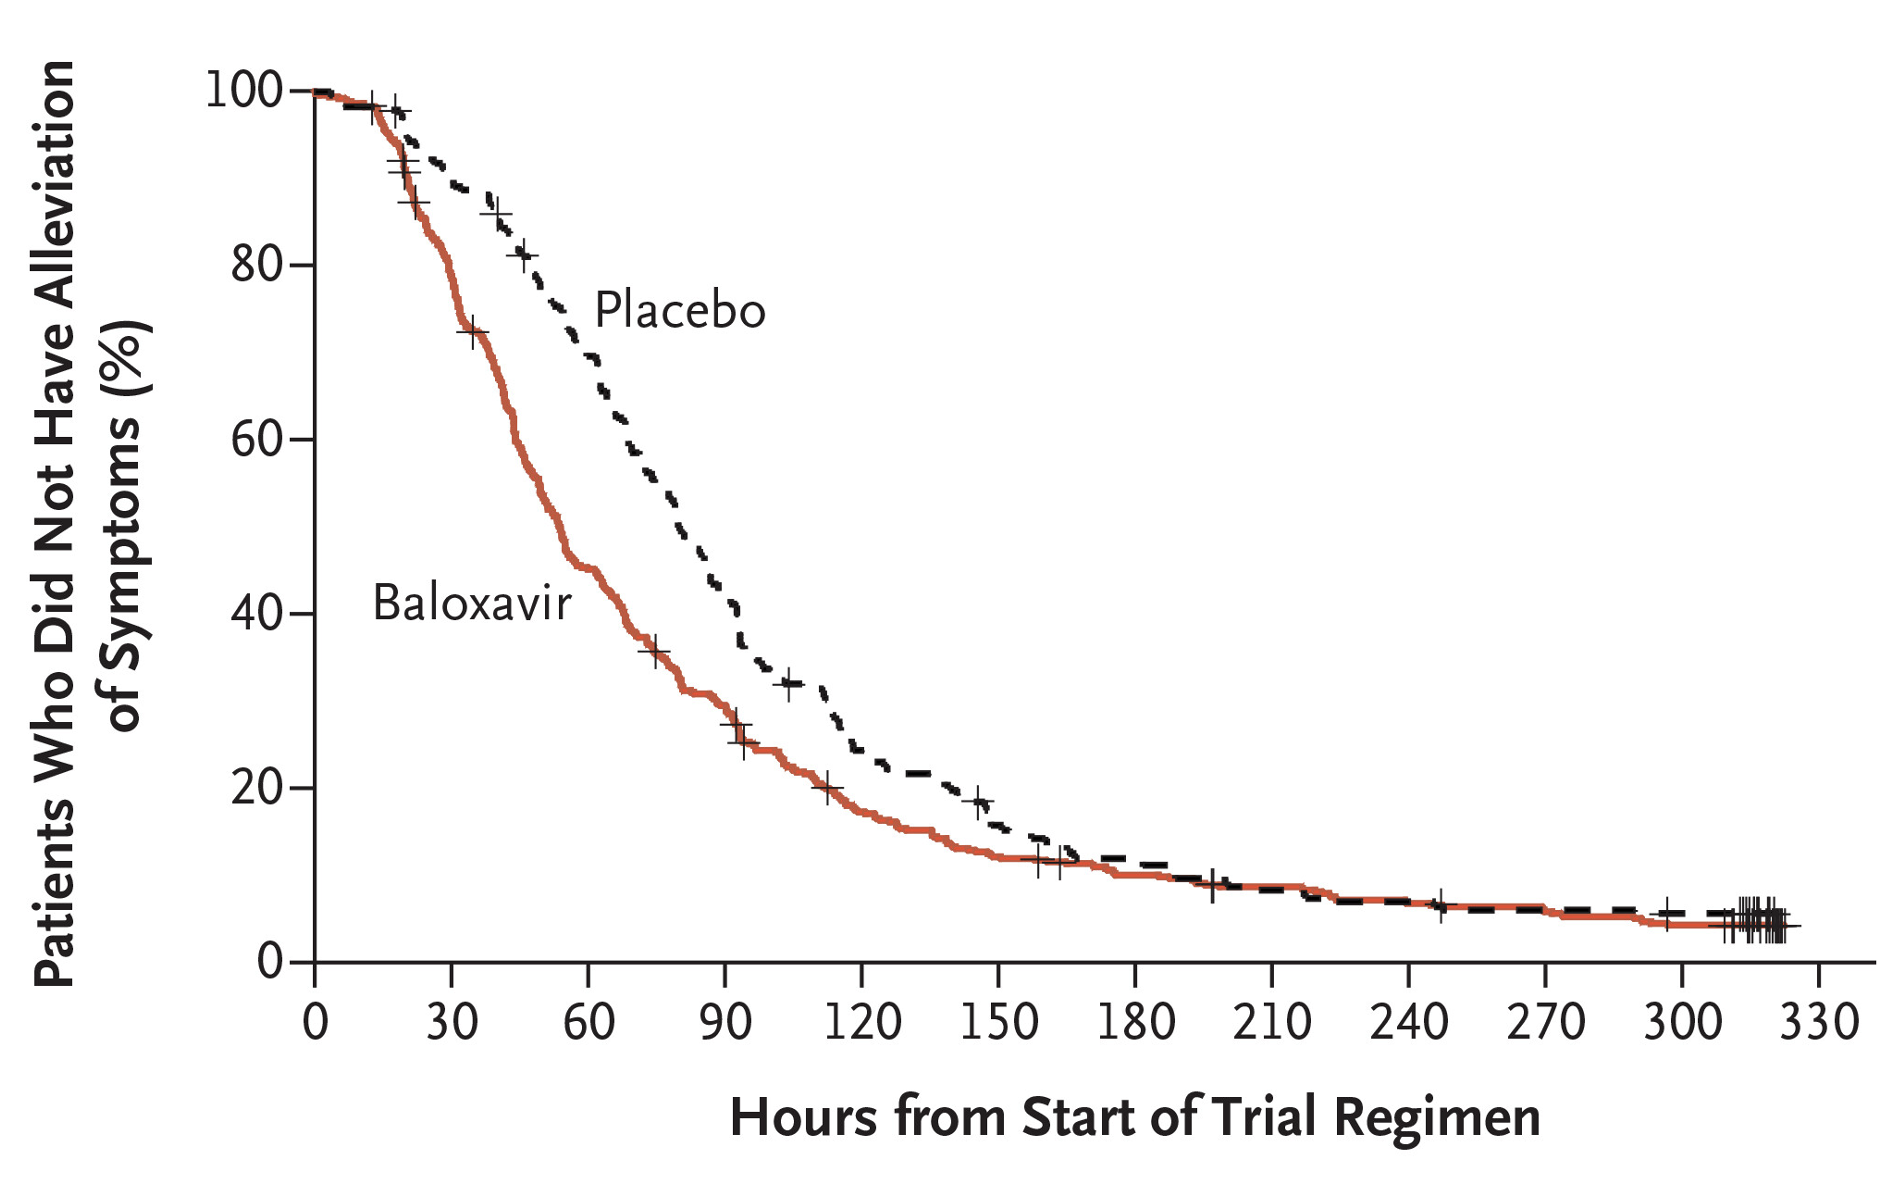
Baloxavir trial results (2018): Kaplan-Meier curve
To summarize a few key points:
Oseltamivir (75mg, twice daily for 5 days after symptoms appear / infection confirmed) relieved all symptoms in 80% of patients within ~5 days of starting the treatment vs. ~7.5 days without treatment
Baloxavir (40 or 80 mg, single dose after symptoms appear / infection confirmed) relieved all symptoms in 80% of patients within 110 hours (~4.6 days) of starting treatment vs. ~140 hrs (5.8 days) without treatment
Note the difference in the time until alleviation of symptoms for the control (placebo) group between trials. In reality, both drugs perform similarly, reducing the time you’re suffering w/ the flu by 24-48 hrs.
Critically, both prescription drugs need to be taken within 48h of initial symptoms to be effective which is not much time to recognize what you have, get a doctors appt., and fill a prescription at the pharmacy (all while sick…)
Baloxavir is conveniently just one pill HOWEVER influenza has been shown to more easily adapt to this drug’s inhibition with a single point mutation in PA conferring resistance, at low fitness cost, in up to 10% of treated patients
In comparison, observations with Oseltamivir indicate the virus adapts detectable resistance conferring mutations in <2% of treated patients presumably due to higher fitness costs associated w/ changes to the NA protein
There are a lot more nuances in the data but I’ll leave it at that for now. Overall, both drugs have been shown to be safe and effective. My main concern is genetic adaptation of circulating strains rendering either drug obsolete.
Now I ask, would you go through the hassle of getting a prescription (while in the early stage of illness) for a 20-25% reduction in total misery? I’m not sure either. Good candidates for OTC?
doi:10.1001/jama.283.8.1016
DOI: 10.1056/NEJMoa1716197
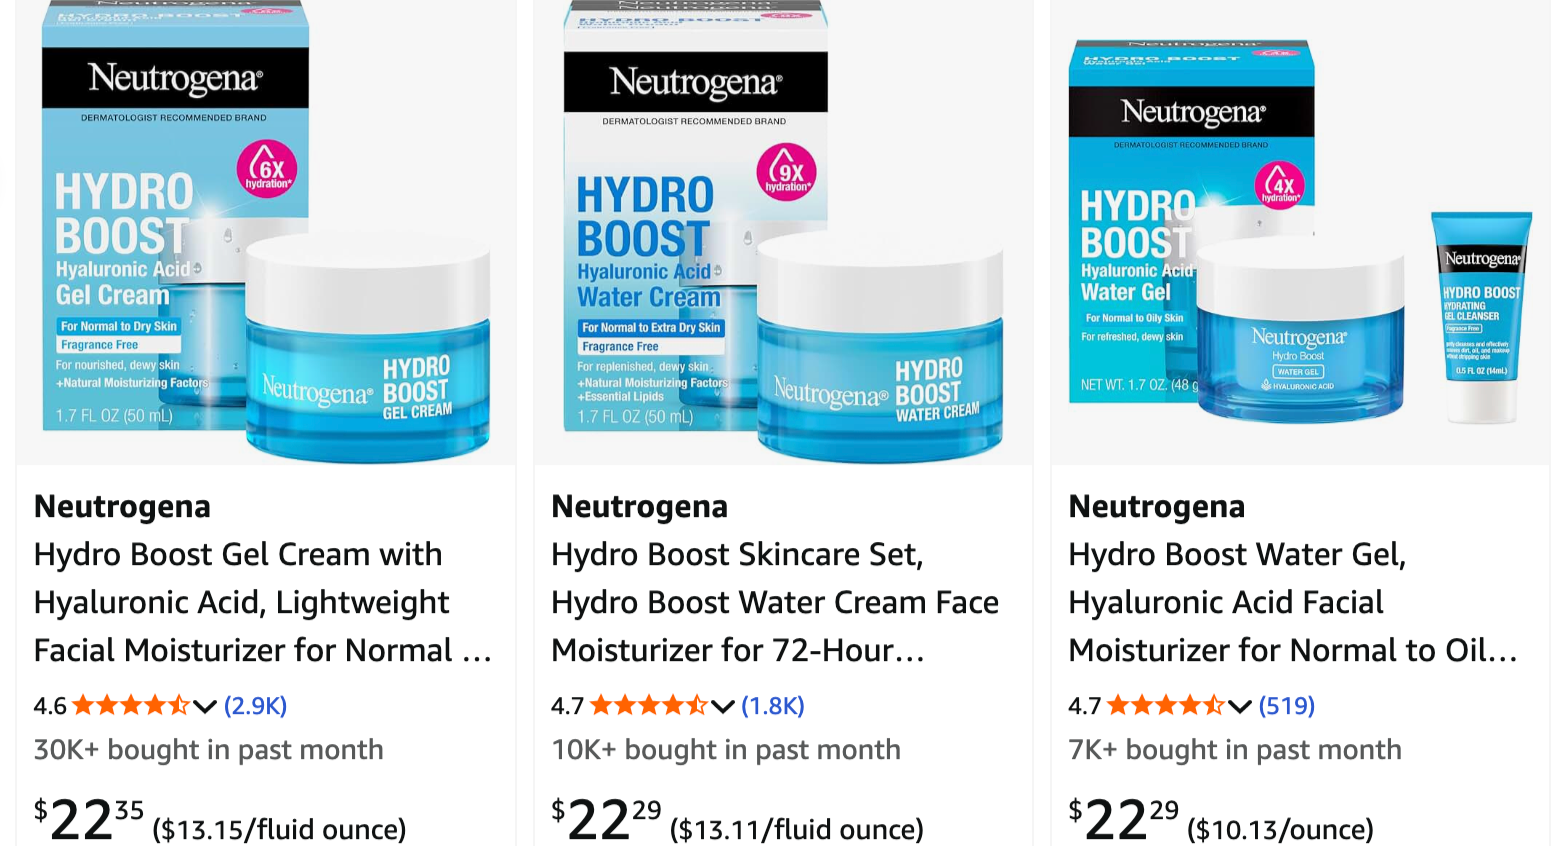
Neutrogena, why?
Love their products (moisturize your skin, people!) but why make the lineup so confusing? I’ve purchased each one of these in the past thinking they’re the same…
Gel cream
Water cream
Water gel
What are the differences? Gemini summarizes nicely (w/ some editing)
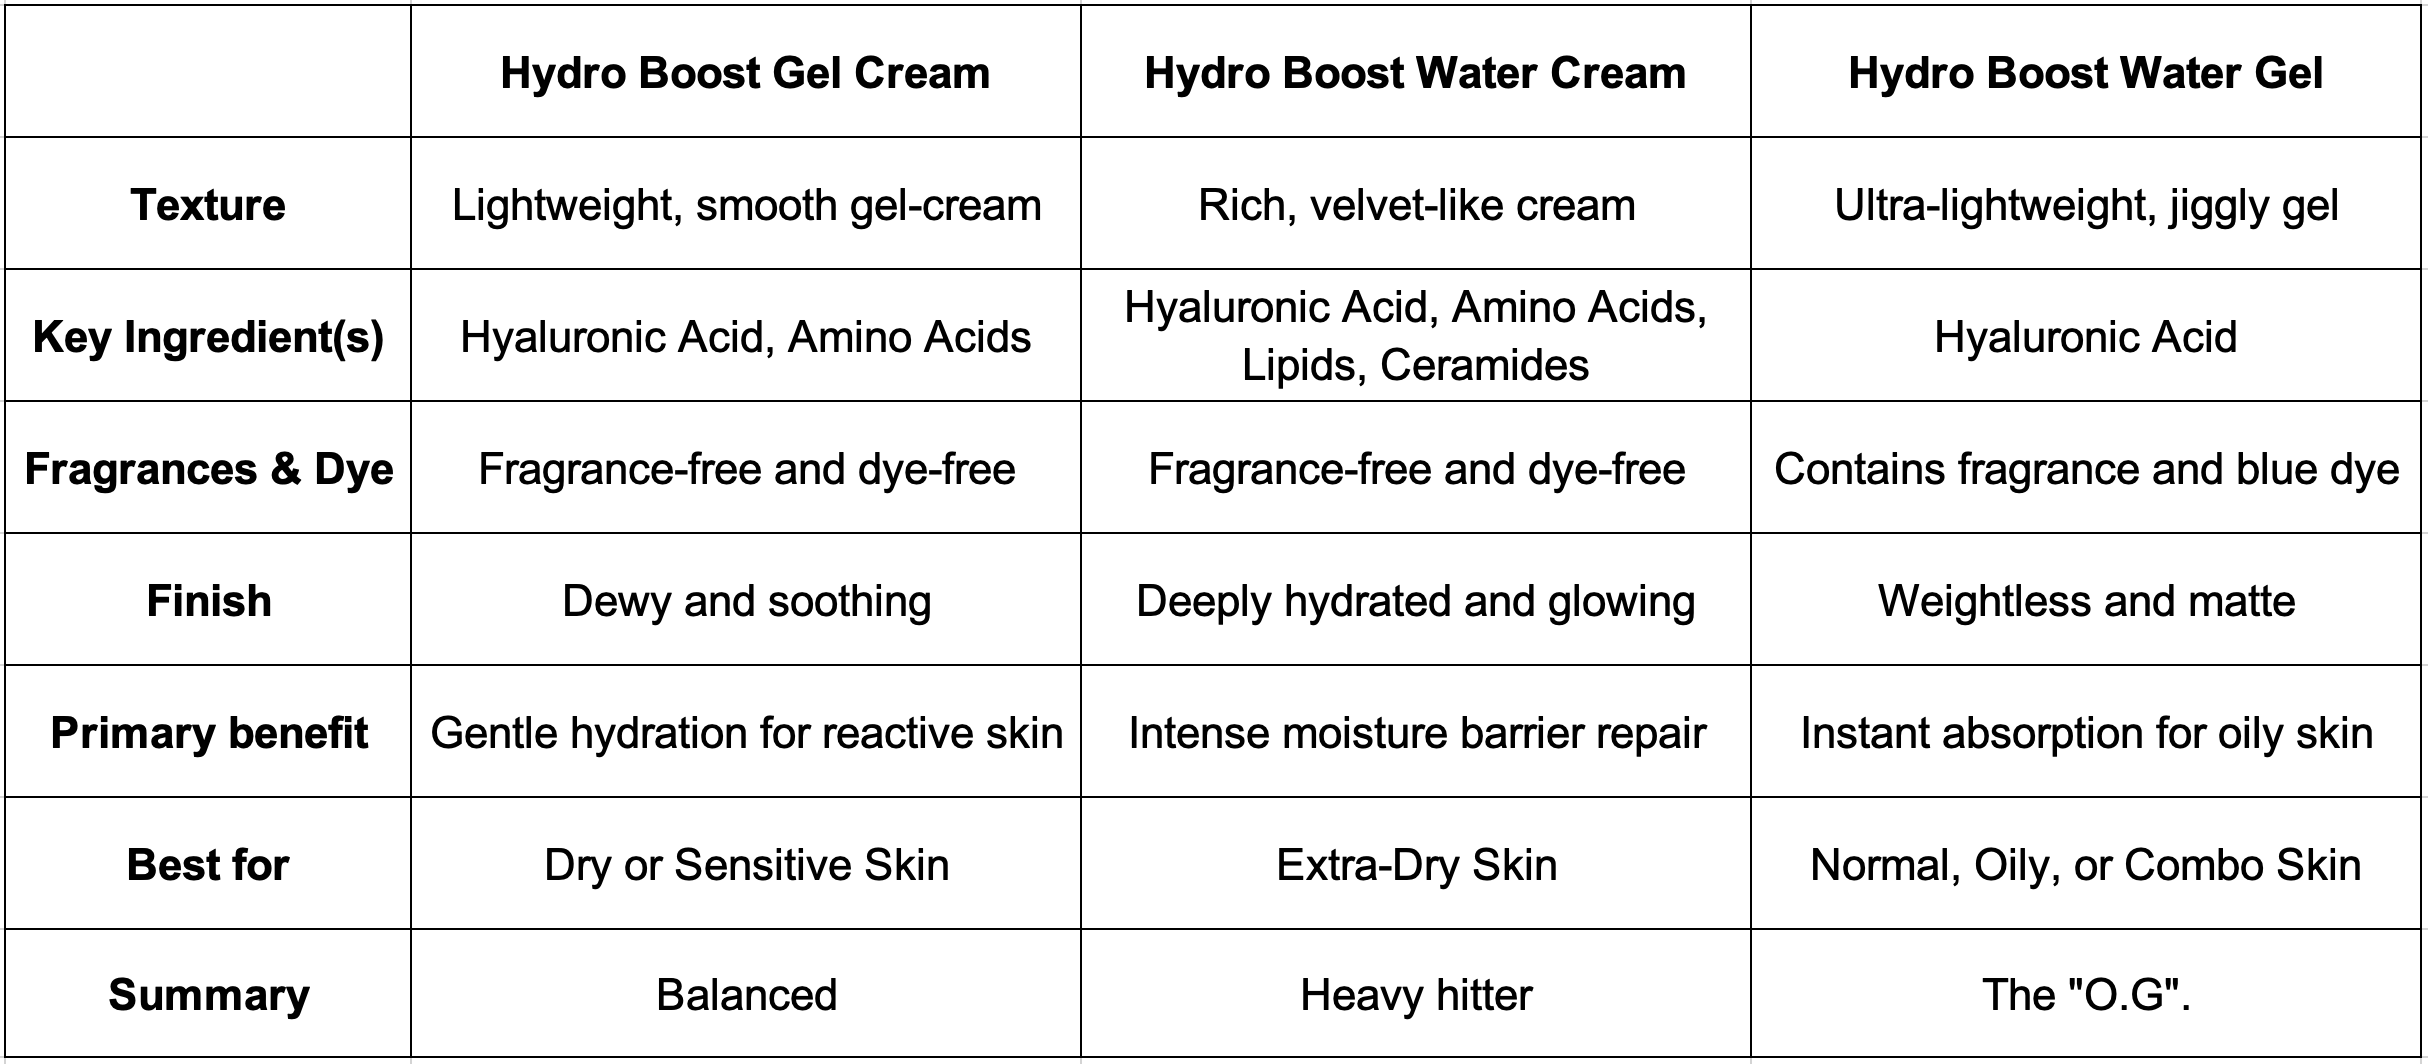
Essentially, “Water Gel” (right) is their older, ultra-light (but more synthetic) product while “Water Cream” (middle) is their new & improved, more natural, max hydration option. “Gel cream” (left) is like an intermediate between the two (I prefer this one for it’s balance)
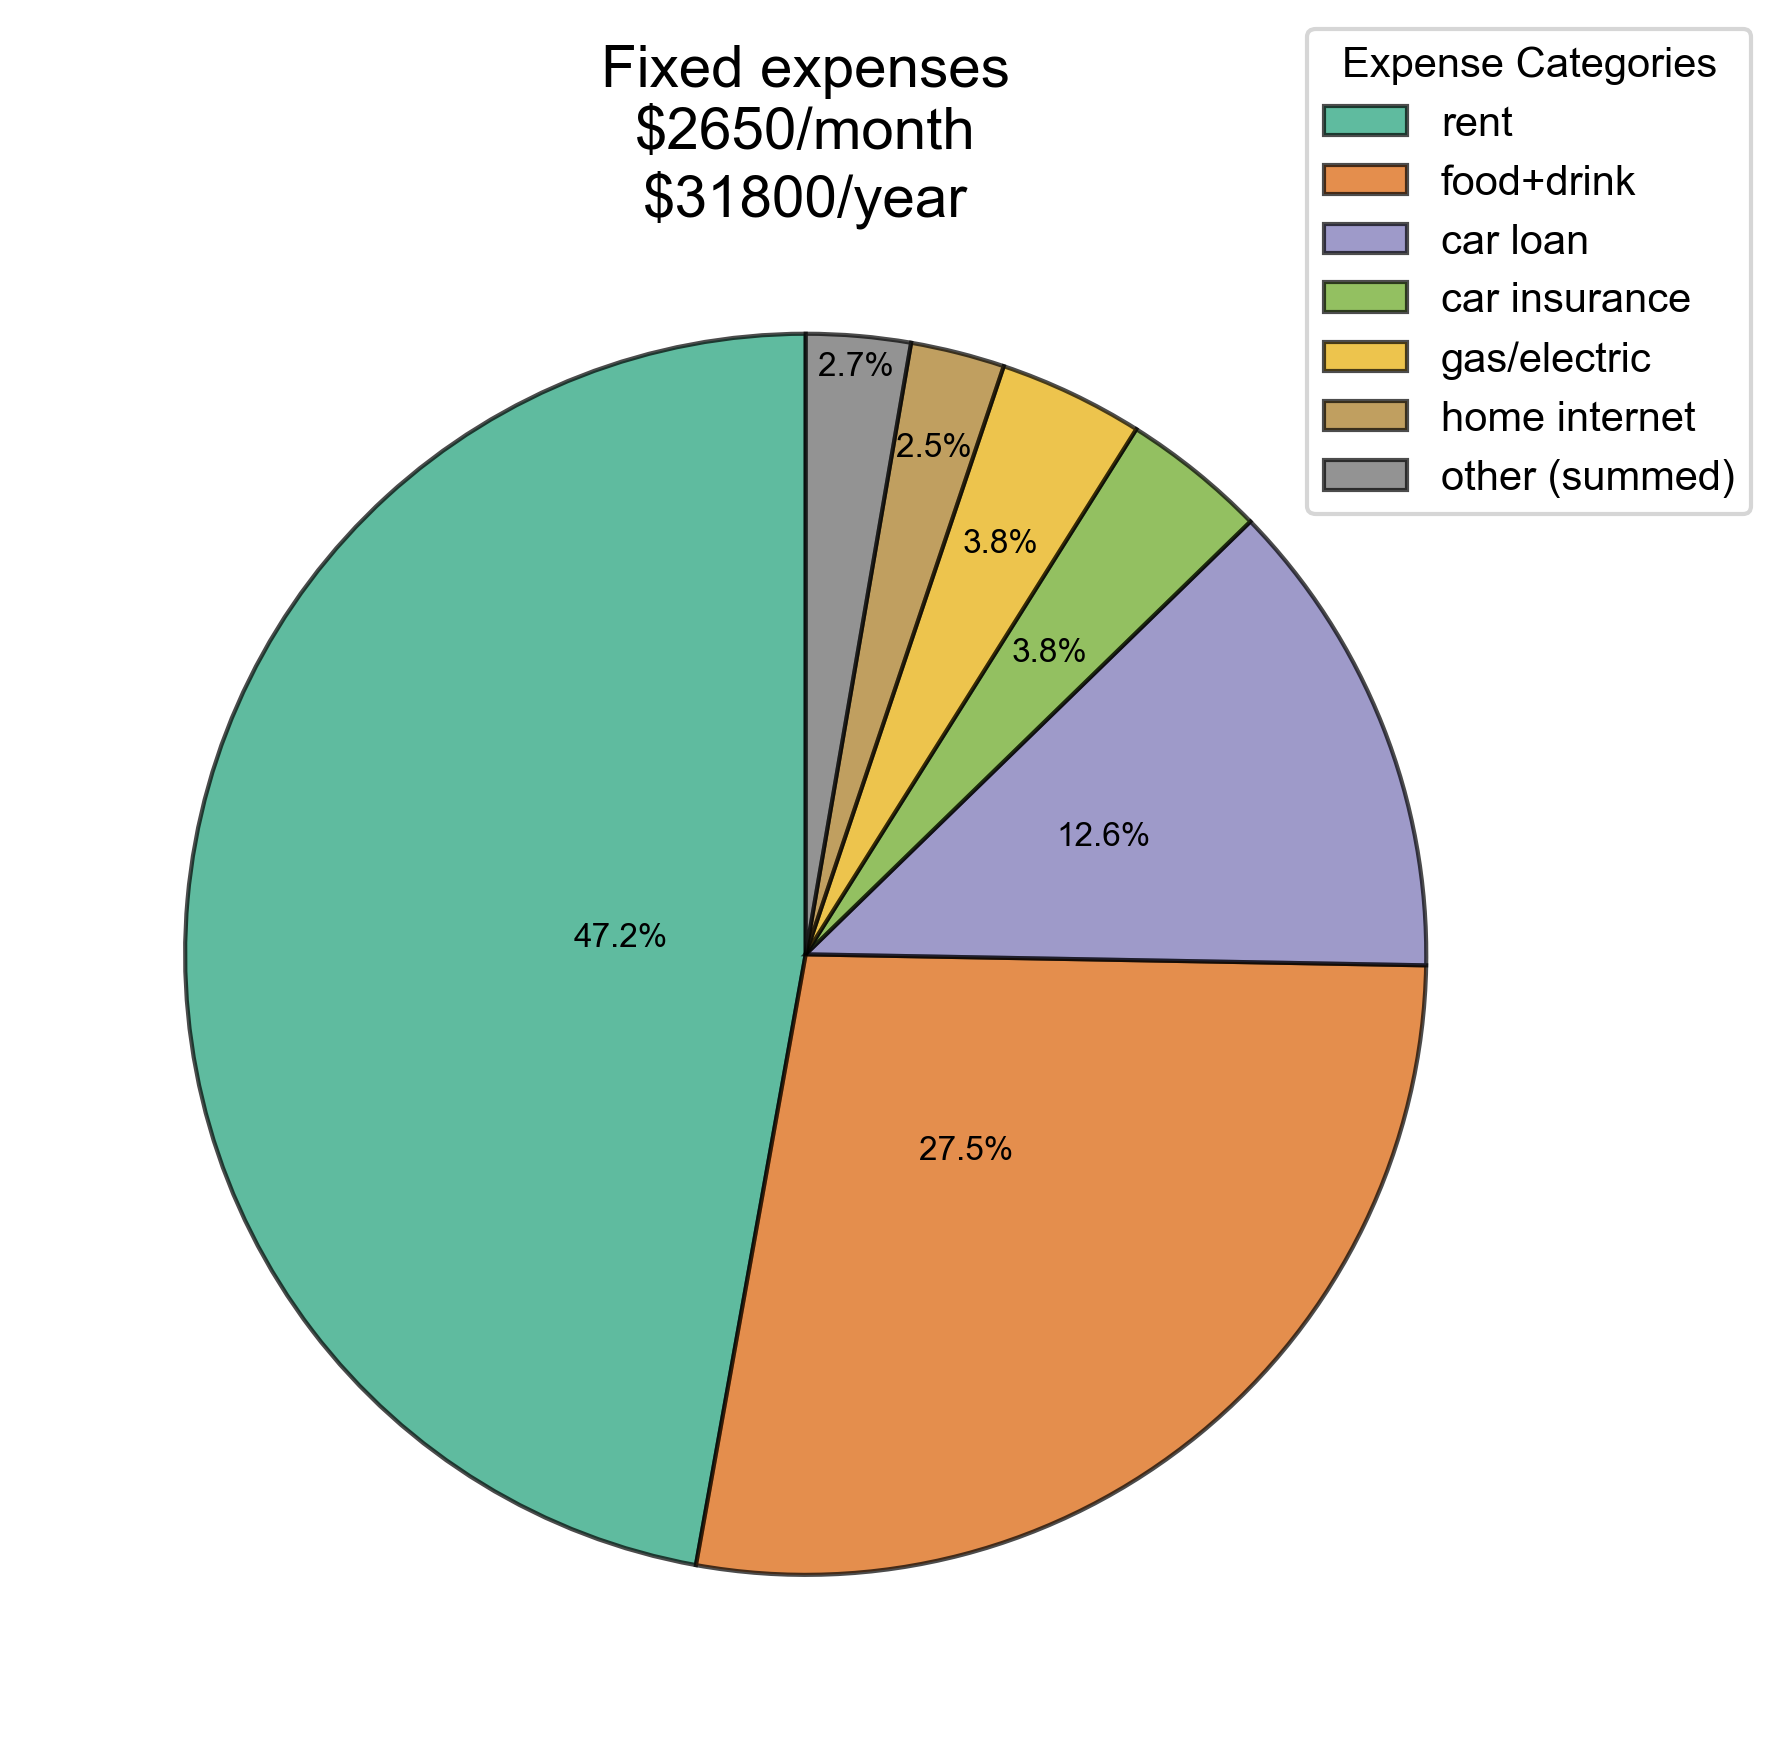
Ryan’s review of recurring expenses (2025)
I strongly believe in financial transparency so here goes...
| Category | Monthly Cost |
|---|---|
| Apartment rent | $1250 | Car loan | $330 |
| Car insurance | $105 |
| Utilities (gas & electric) | $100 |
| Internet plan (Xfinity) | $65 |
| Tolls (EZpass) | $20 |
| Phone plan (5Gb/mo) | $15 |
| Renter's insurance | $12 |
| Other subscriptions (summed) | $25 |
| Groceries | $365 |
| Dining out (coffee, restaurants, etc.) | $365 |
| Total | $2650 |
Categorical percentages of fixed monthly expenses
Takeaway? 90% of costs are food, shelter, transport…
Table made by HTML injection (I’m learning!)
Piechart made w/ matplotlib in Python
So total fixed costs = $2,650 / month * 12 ~= $32,000/year… probably more like $33,000/yr accounting for more sporadic consumables (e.g. cleaning supplies, personal health, etc.)
Grad school absorbs some fixed costs by providing gym, cheap health insurance plan, parking, and most wifi (hence the 5Gb/mo phone plan)
I couldn’t believe the amount I spend on food/drink each month but I got the #s based on detailed breakdowns provided by my bank so I know they’re accurate
Gemini estimates median monthly spending on food+drink for an individual adult in the U.S. at ~$555 / month. I guess I’m somewhat at peace with being 30% over that in NJ w/ a coffee habit and affinity to farmers markets
Standard federal tax deduction for single filer in 2025 is $15,750 i.e. covers ~50% of what I consider my base annual expenditures to live. Interpret that however you’d like…
Oh last comparison! At $16/hr (NJ minimum wage) * 40 hrs/week * 52 weeks/yr (no vacation) ~= $33,000 annual pre-taxed income meaning you have barely enough to get yourself by and no ability to save (@USA)
Hallmarks of cancer
My previous post offered a somewhat pessimistic take on human health, essentially framing disease (I’ll focus on cancer here) as the body gone wrong, whether caused by internal or external factors, through acute events or accumulated wear. From this perspective, life is a temporary victory against entropy—a struggle to maintain a metastable equilibrium while constantly bombarded by events trying to knock us out of it.
However, a converse view is that cancer is not just random chaos; it follows a set of characteristic behaviors. A normal cell must acquire specific aberrant capabilities to become a lethal tumor. These are known as the Hallmarks of Cancer, a framework originally defined by Hanahan & Weinberg in 2000 and later expanded in 2011 and 2022.
This framework offers a more optimistic view on health. It argues that cancer is not an unstoppable force, but a process with distinct requirements. If we can identify and target the mechanisms that allow cancer cells to survive, proliferate, and invade, we can intervene before the system as a whole is affected. This highlights the benefit of modular biology: because we are made of discrete cells, faulty units can be repaired or removed without compromising the rest. The graphic to the right, from 2011, illustrates the hallmarks of cancer (inner circle) alongside classes of drugs (outer circle) designed to target, prevent, and/or take advantage of them to kill neoplastic cells. A few more have been added since but they get increasingly nuanced.
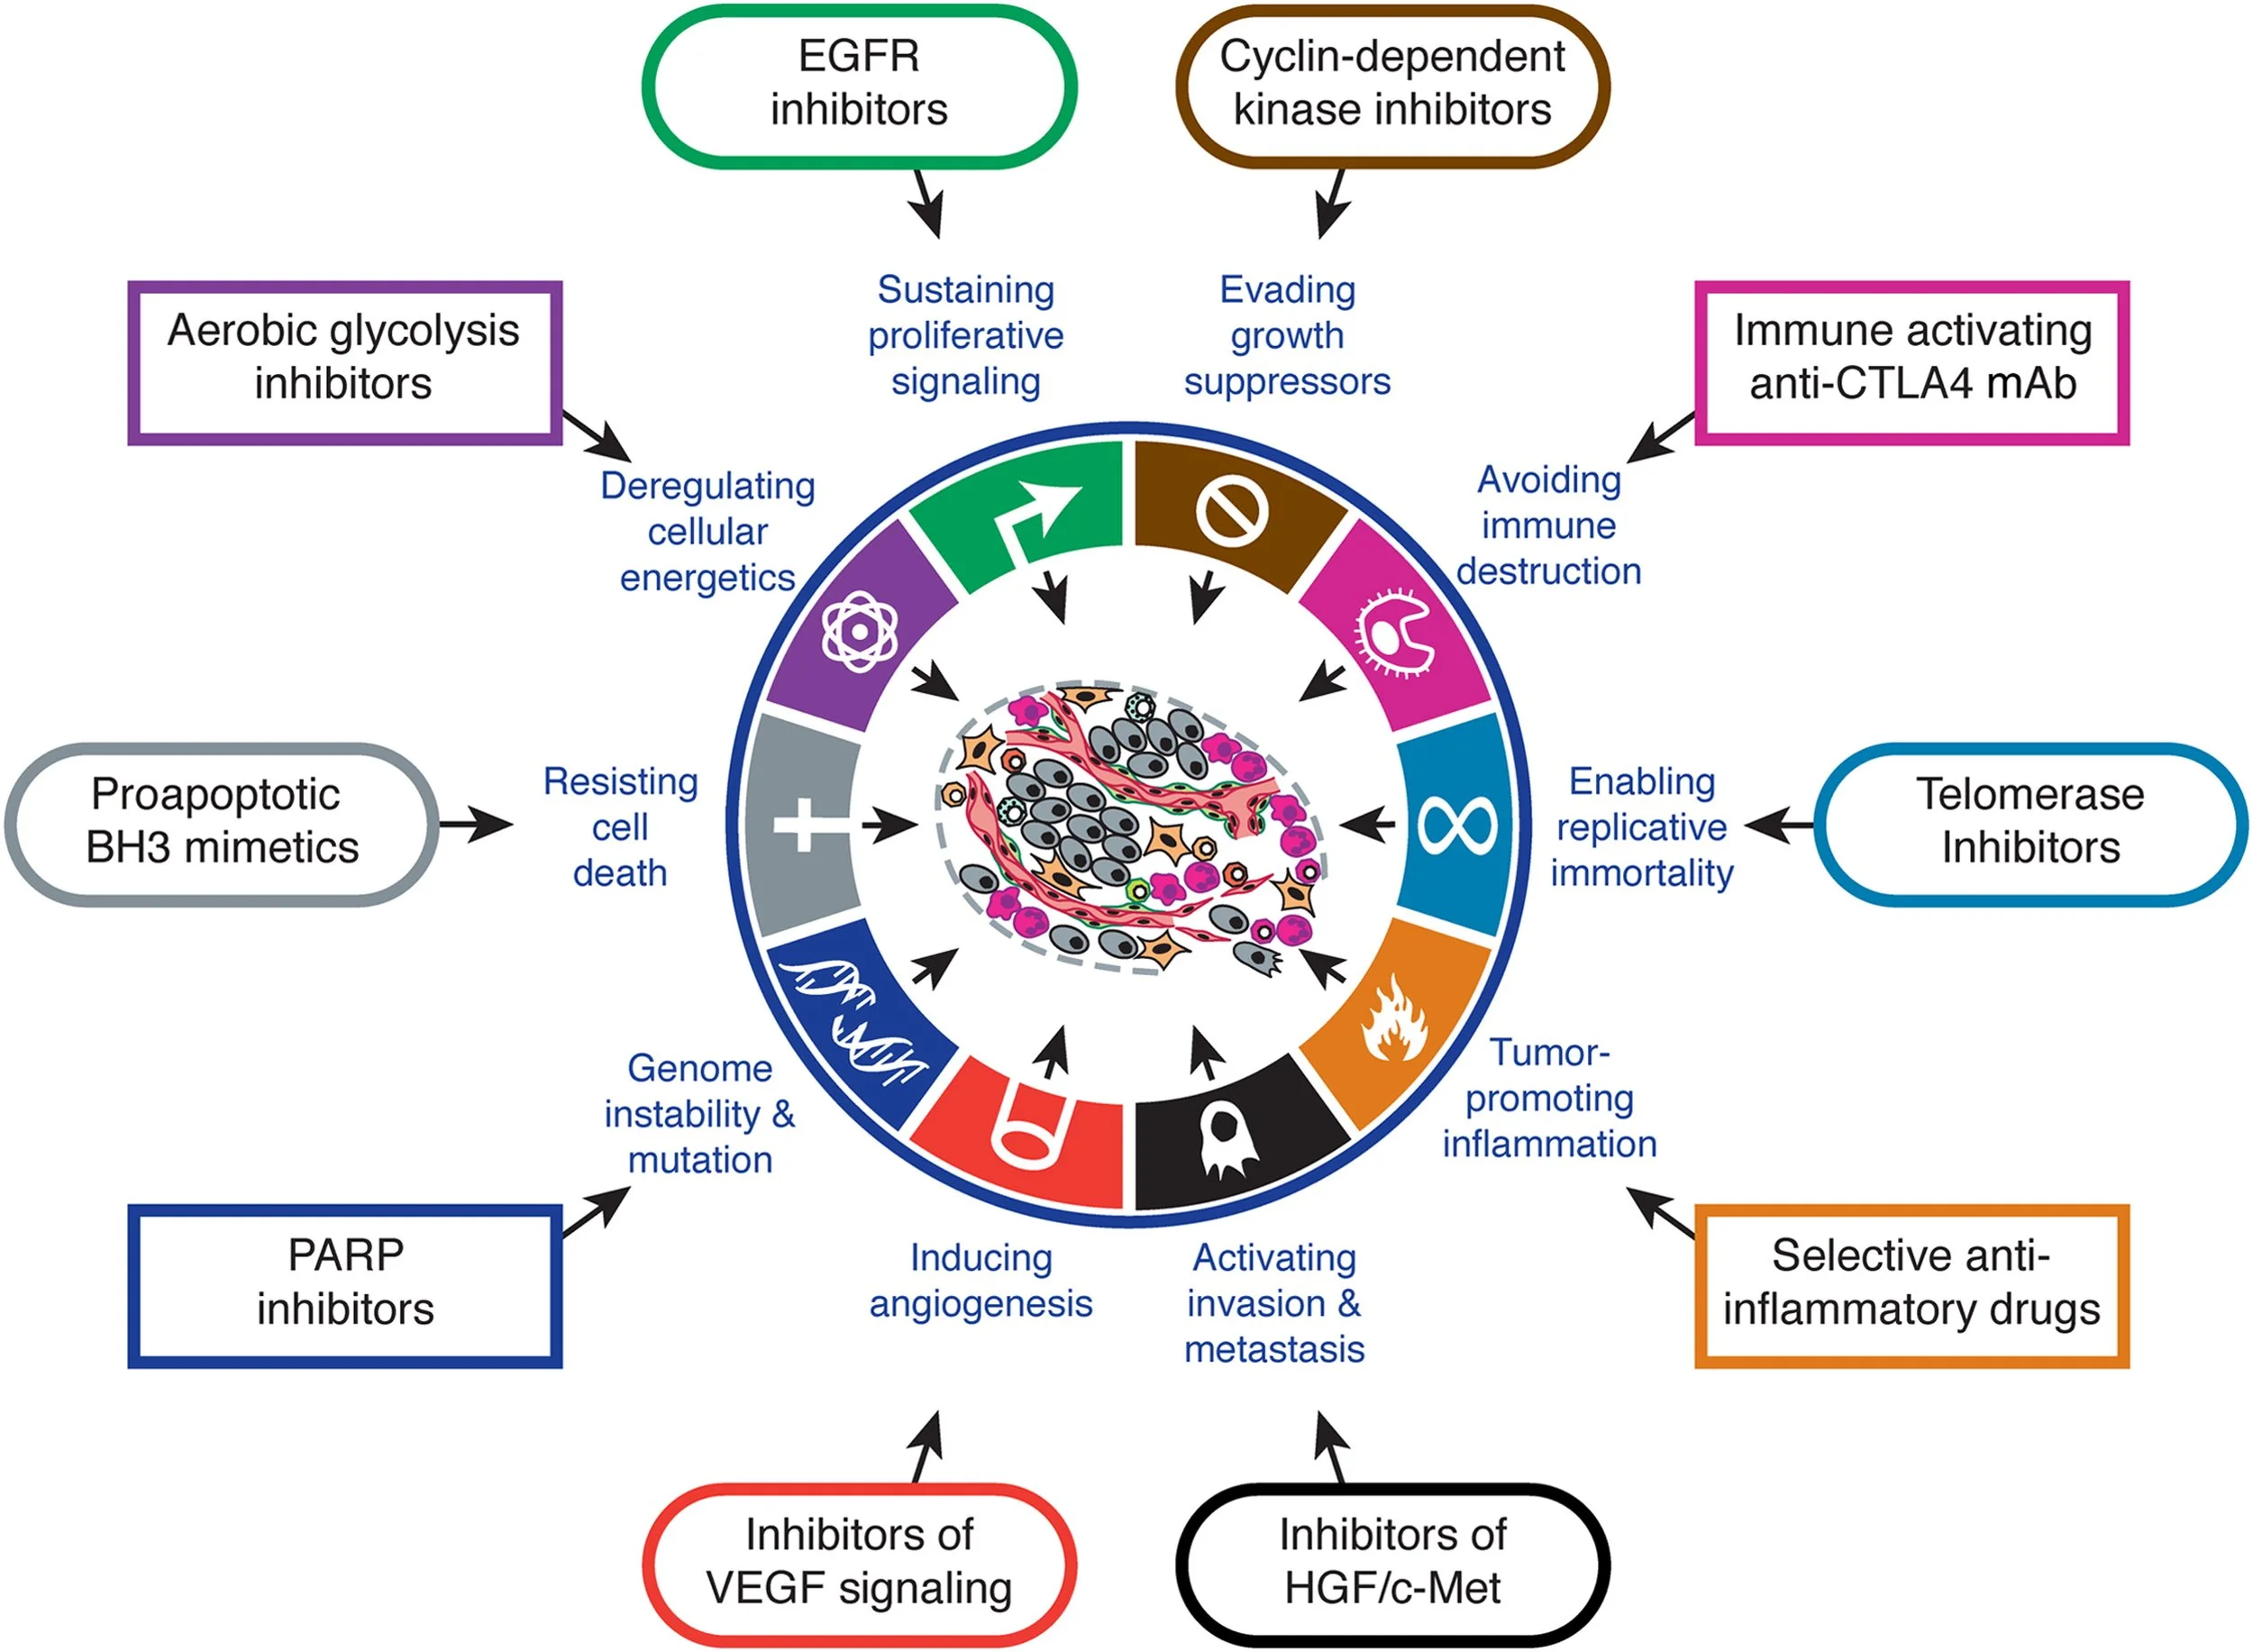
Hallmarks of Cancer: The Next Generation. Hanahan, Douglas et al. Cell, Volume 144, Issue 5, 646 - 674
Follow-up on air quality
Regarding my earlier concern about NJ air quality, two recent articles in WSJ emphasize why it matters
The causes of disease, including cancer, can be loosely corralled into four groups:
Endogenous failures (e.g. DNA replication errors, cross reactive molecules (ROS/RNS), hormone imbalances)
External biological factors (e.g. infection by viruses, bacteria, fungi, parasites)
External chemical factors (e.g. toxins, alcohol, pesticides, PFAS, asbestos)
Radiation (e.g. UV, X-rays, gamma-rays)
I think we currently underestimate the impact of all of them, but especially #3 which is incredibly broad and often airborne
ICYWW, central NJ to central VA (one-way) stats:
350 miles by I-95
6 hours w/ gas car & no traffic
7-8 hours w/ electric car & no traffic
2 short charging stops or 1 longer stop
$16 in base tolls + $32 if using express-way (!)
Pass through Baltimore (by tunnel) and around Washington DC (kinda)
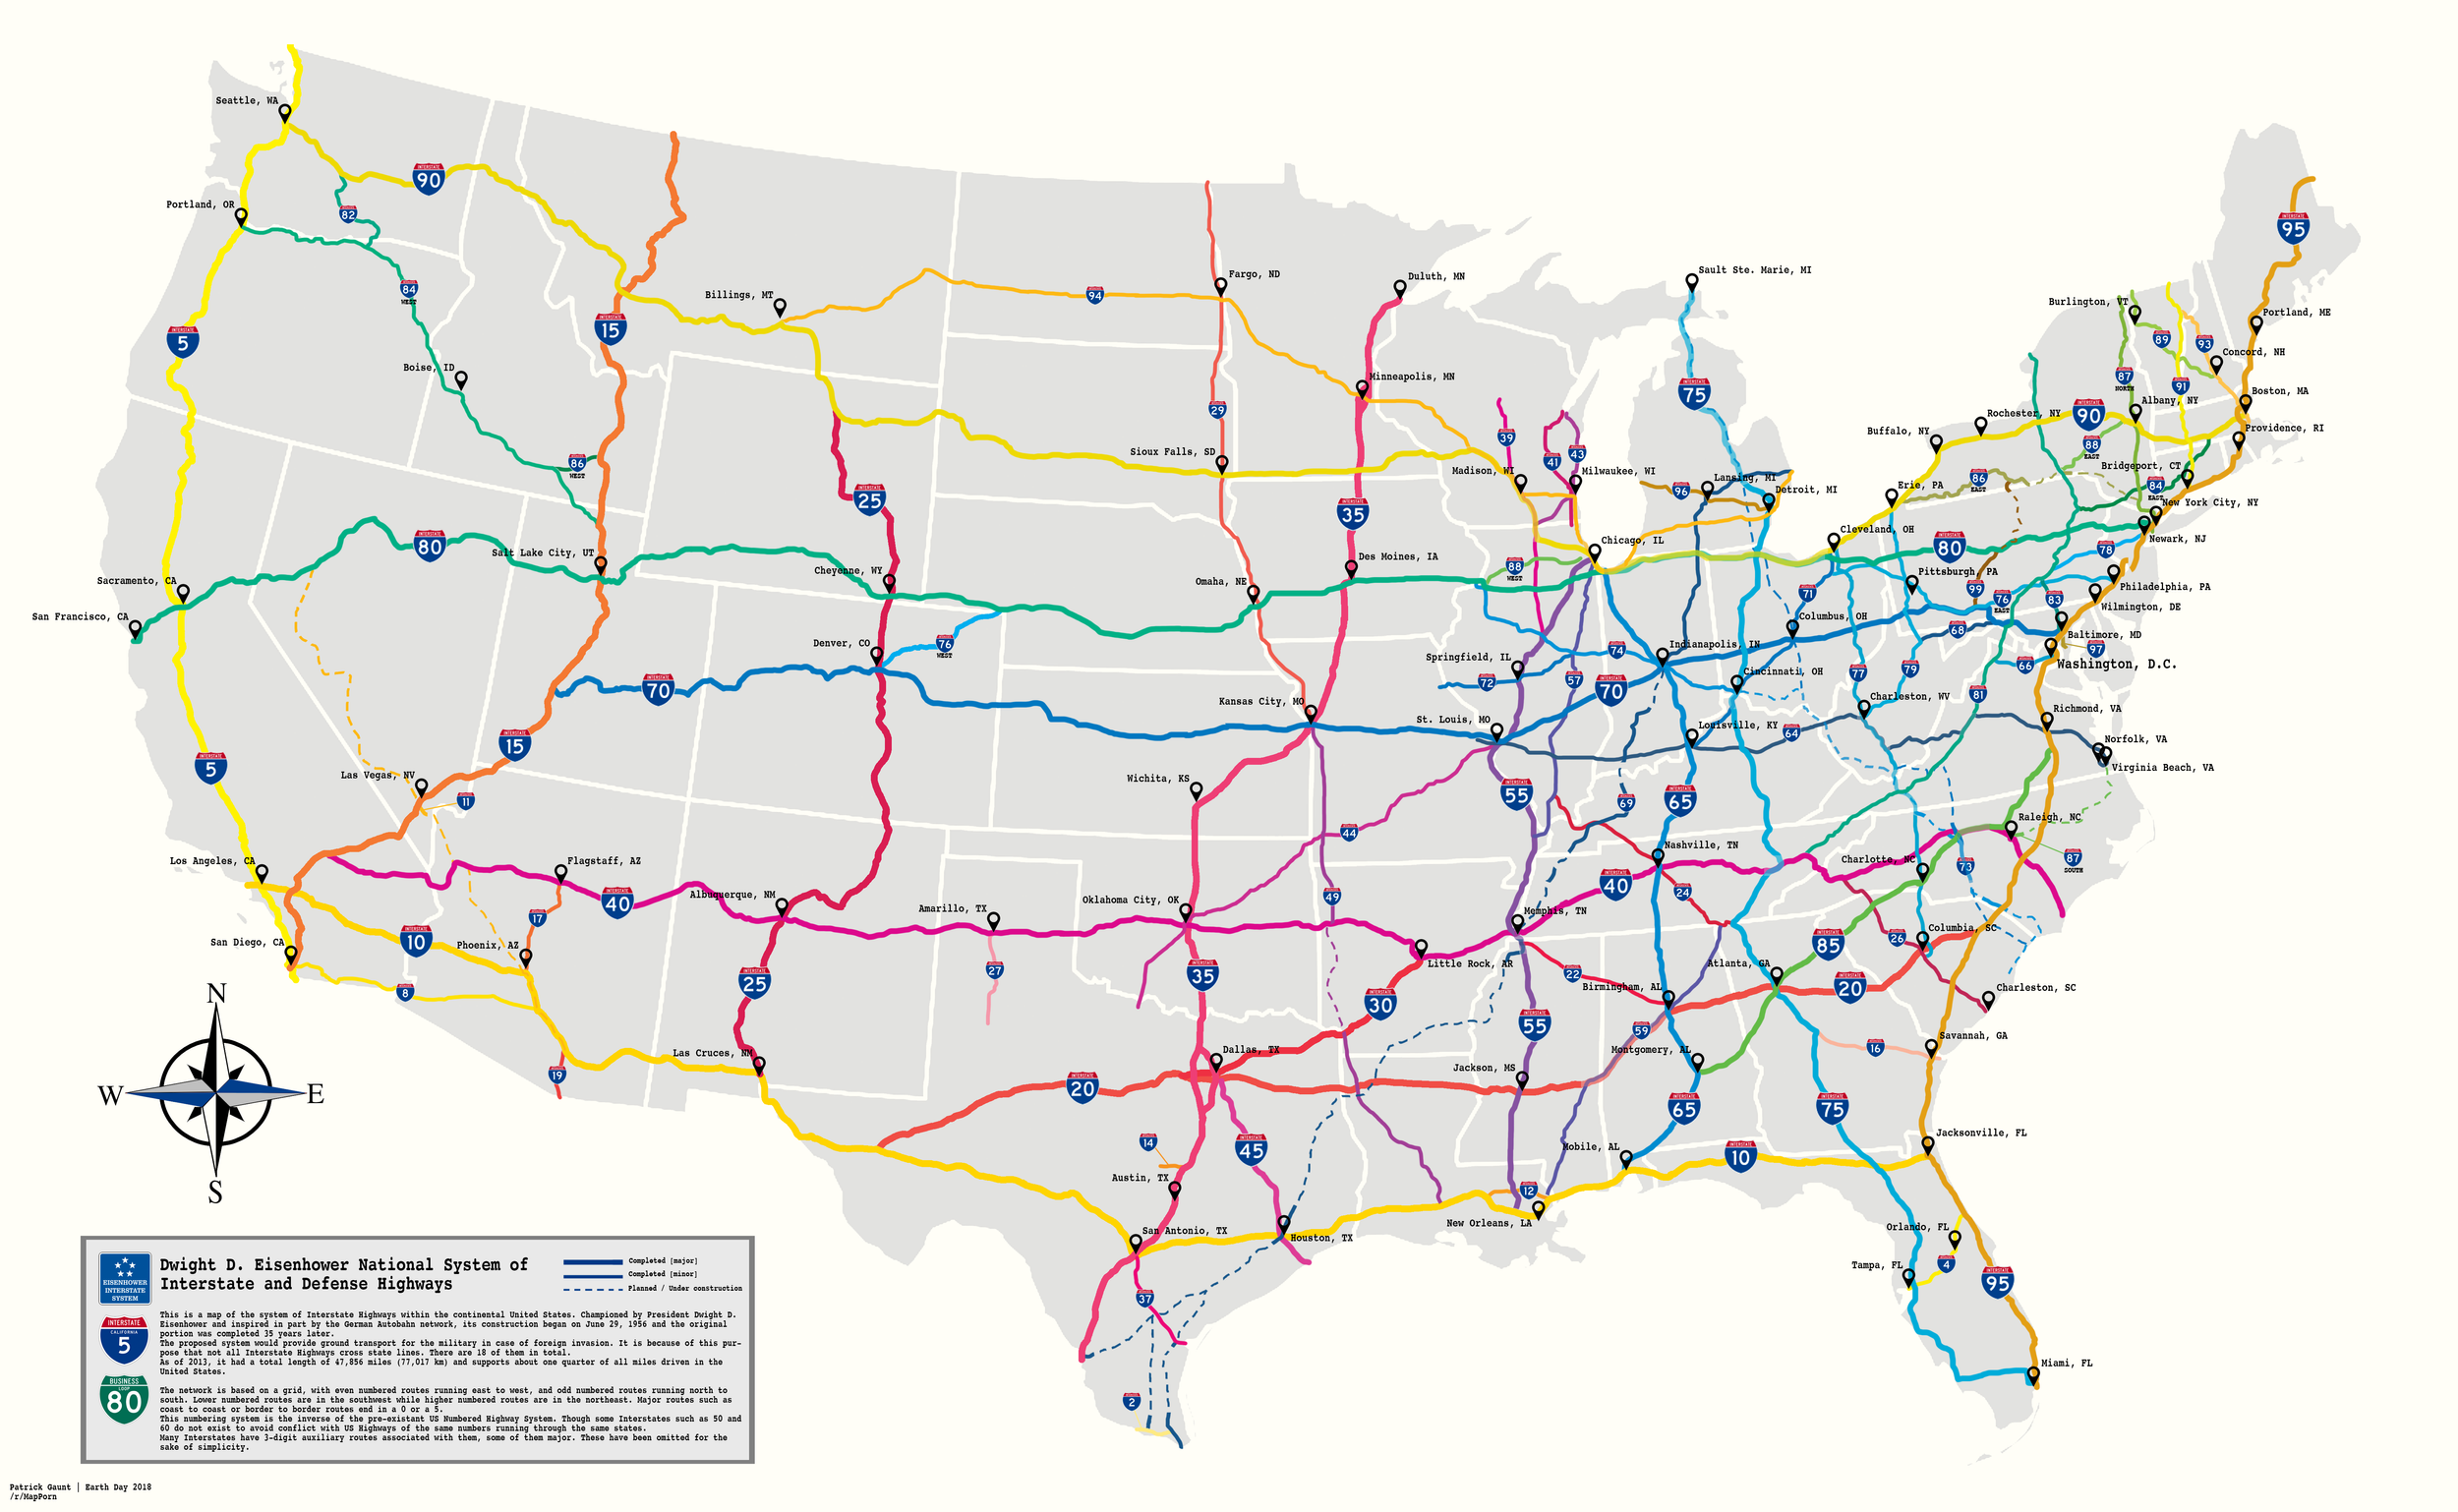
The major roadways in the U.S. follow a loose structure where roads running vertically (i.e. North-South i.e. latitudinally) are odd numbers and roads running horizontally (i.e. East-West i.e. longitudinally) are even numbers. Also, the numbers of the roads get larger as you move up and to the right (diagonally northeast) across the country.
Interestingly, if you zoom in you’ll notice a gap in I-95 on the border of PA and NJ. The map is old, this disruption no longer exists. In 2018 an interchange was completed that connected it. Before, southbound I-95 merged into I-276 (PA turnpike) while northbound I-95 merged into US 1 and I-295. Very confusing back then, even now honestly as all those roads still connect/overlap, however, it is now possible to drive ~2,000 miles from south Florida through Maine on a continuous stretch of pavement called I-95.
Traveling by car in the U.S.
Another EV post…
This post (https://www.recurrentauto.com/news/real-world-range-for-tesla) would almost be unbelievable if it weren’t for the fact that I have a good friend who owned a Model 3 for a few years in Texas who consistently complained about getting <70% of the EPA estimated range… I think Tesla’s had/have a quality control issue w/ their battery packs where some cars perform as advertised and others much poorer. Either that or they found a way to cheat the EPA tests and over-inflate their numbers. Perhaps since 2023, after this data was collected and my friend ended his lease, Tesla improved their vehicles, but I truly think there’s some weight to the conspiracy. Also, the data on the Bolt match my own observations, the range indicator is very good and I typically get 60-70% of the EPA range in the dead of winter.
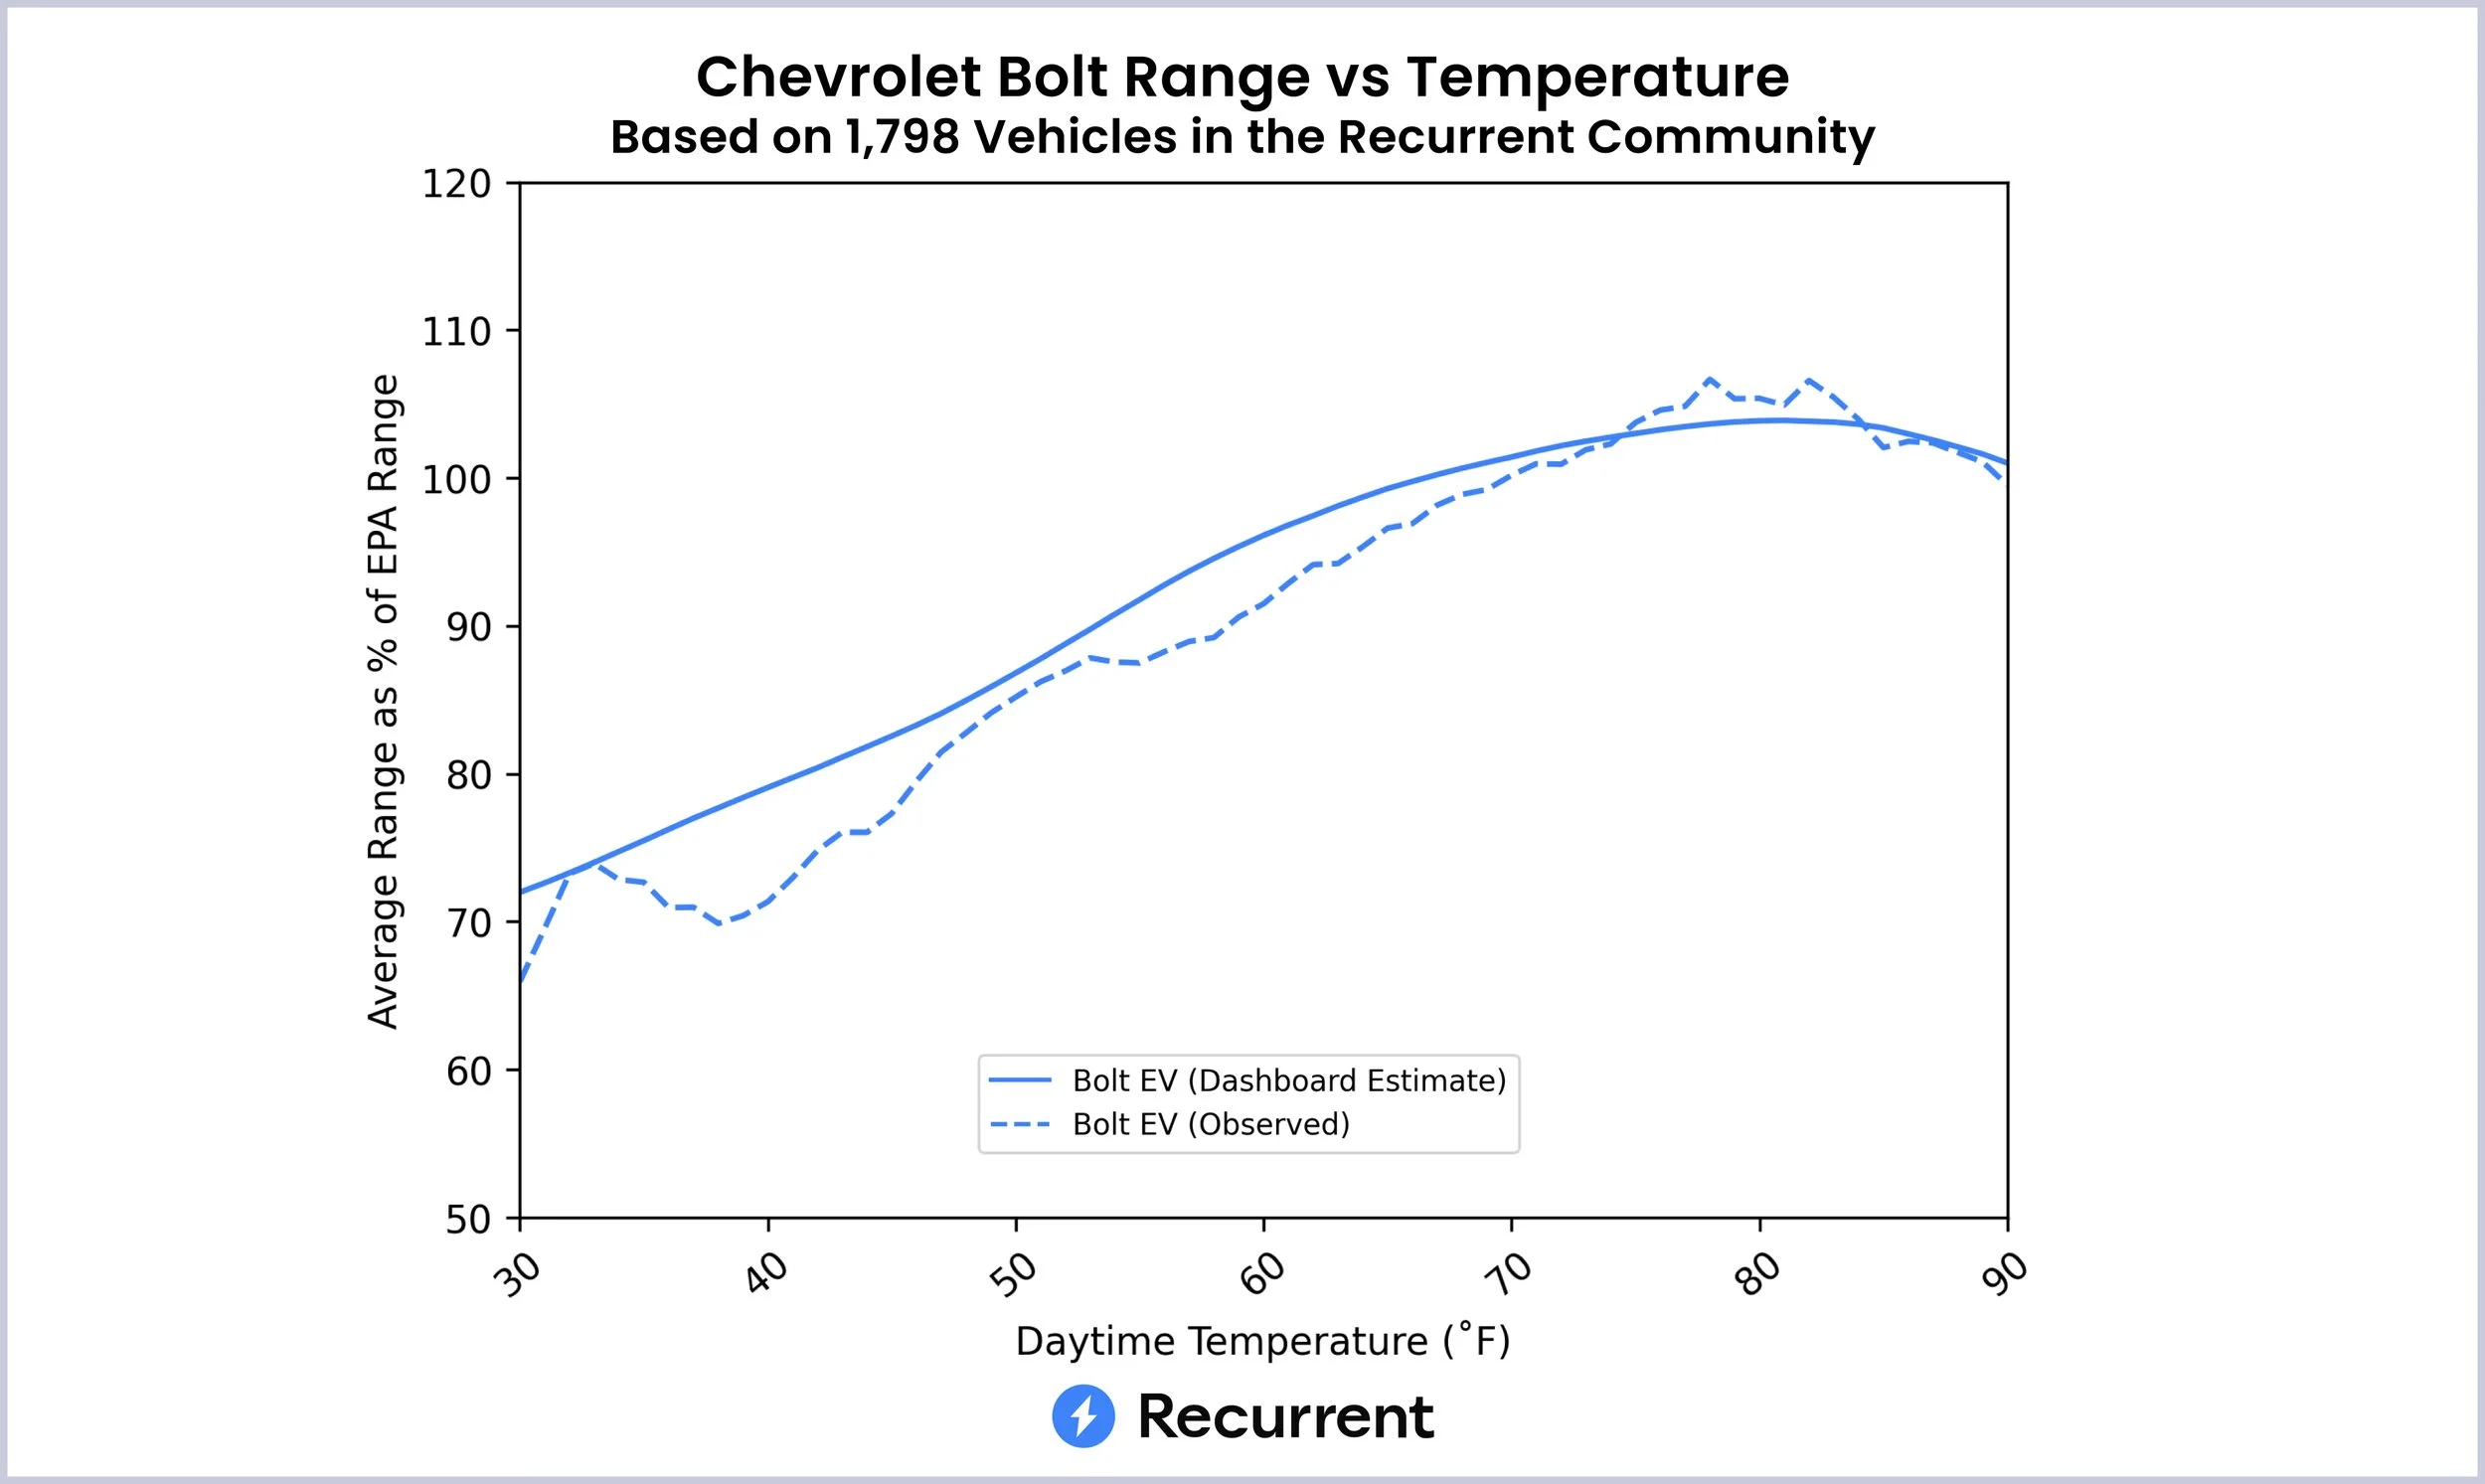
Can confirm from a recent long trip that 30-35F results in a total range of ~180 miles highway (avg. 60 mph)

Trends in baseball
Weird plot essentially saying .280 is the new .300 and .300 is the new .330 in the MLB
Cool of WSJ to highlight the generational hitters: Ty Cobb (1900-1920s), Roger Hornsby (1910-1920s), Ted Williams (1940-1950s), Tony Gwynn (1980-1990s). It seems like every 20-30 years a star is born…
…Where’s our star of the early 21st century? Is it Luis Arraez?
From https://www.wsj.com/sports/baseball/batting-champion-300-average-9a098a0d?mod=hp_listb_pos1
EV stats after 3 years

Very pleased with my Chevy Bolt’s range after 3 years. Recently traveled to Long Island and back on a single charge, using AC set to 70-72F the whole time (it’s mid August right now)
Made it back w/ ~50 miles to spare, averaging ~5 mi/kWh (the car has a 65 kWh battery)
Lifetime, I’ve averaged 4.0 mi/kWh over 27,000 miles in 34 months (~800 miles / mo)
The 2023 Bolt uses a lithium-ion battery with NMC chemistry (not LFP… coming soon)
“NMC” = nickle: manganese: cobalt in ~6:2:2 ratio. Returns ~80% battery capacity after 2000 charge cycles
LFP degrades slower (80% in 3000+ cycles) but is also less energy dense & performs worse in cold temps.
To maintain the battery, I try to keep it within a 20-80% state of charge (w/ long drives the exception)
Currently charging 1-2x per week, I expect to reach 2000 cycles in 20+ years…
Overall, these are great stats. The EPA projected range was 259 miles when I bought it, which has been spot on (4.0 miles / kWh * 65 kWh = 260 miles) with one-pedal driving.
Still can’t believe Chevy discontinued the model the year after I bought it… think about how many potential customers were lost in the past 3 years with people craving an affordable, non-Tesla EV option. Fortunately, they’re bringing it back soon but I think the damage is done
Air quality in NJ
Empirically, it seems like there have been more “hazy days” in NJ the past couple of years. Also, I don’t recall ever hearing about Canadian wildfires as a kid and now I hear about them all the time. Looking into it, there doesn’t seem to be any particularly alarming data outside of 2023 when Canada experienced some particularly large wildfires. The 2023 NJ air quality report is the latest update (posted December 2024, not sure why it takes a full year to issue…). I’m surprised there wasn’t a noticeable increase in unhealthy days in NJ in 2023 because I distinctly remember a week in early summer when the sky was orange every day because of wildfire smoke. Altogether, it shows how a single deviation (2023) can bring sustained attention to a subject. Will be very interested in the 2025 data… UPDATE: Something I was reading mentioned this as “frequency illusion” (or the Baader–Meinhof phenomenon) which is thought to be a combination of cognitive priming, selective attention, and confirmation bias.

From https://dep.nj.gov/wp-content/uploads/airmon/nj-aq-report-2023.pdf

From https://cwfis.cfs.nrcan.gc.ca/ha/nfdb
Major league baseball

I’m amazed hits have so consistently remained at ~9/game while Ks have tripled…
9 hits / 27 outs = 1 hit every 4 “at-bats”, which doesn’t include walks (i.e. a .250 batting average)
9 Ks / 27 outs = 1 strikeout an inning
I originally thought the consistency was due to the design of the field with defensive players effectively covering ~70% of it, however, the fact that strikeouts (non-contact outs) have tripled means that balls put into play are now more likely to become hits…
Is this a Pareto front in the game: crazier pitches = crazier hits, resulting in a lower defensive efficiency?
Maybe not if players can change position based on hitter, pitcher, and even pitch being thrown but with MLB now limiting defensive shifts, maybe?
Lot going on in this graph…
From https://www.wsj.com/sports/baseball/mlb-hitters-strikeouts-cd09ac73?mod=hp_listb_pos1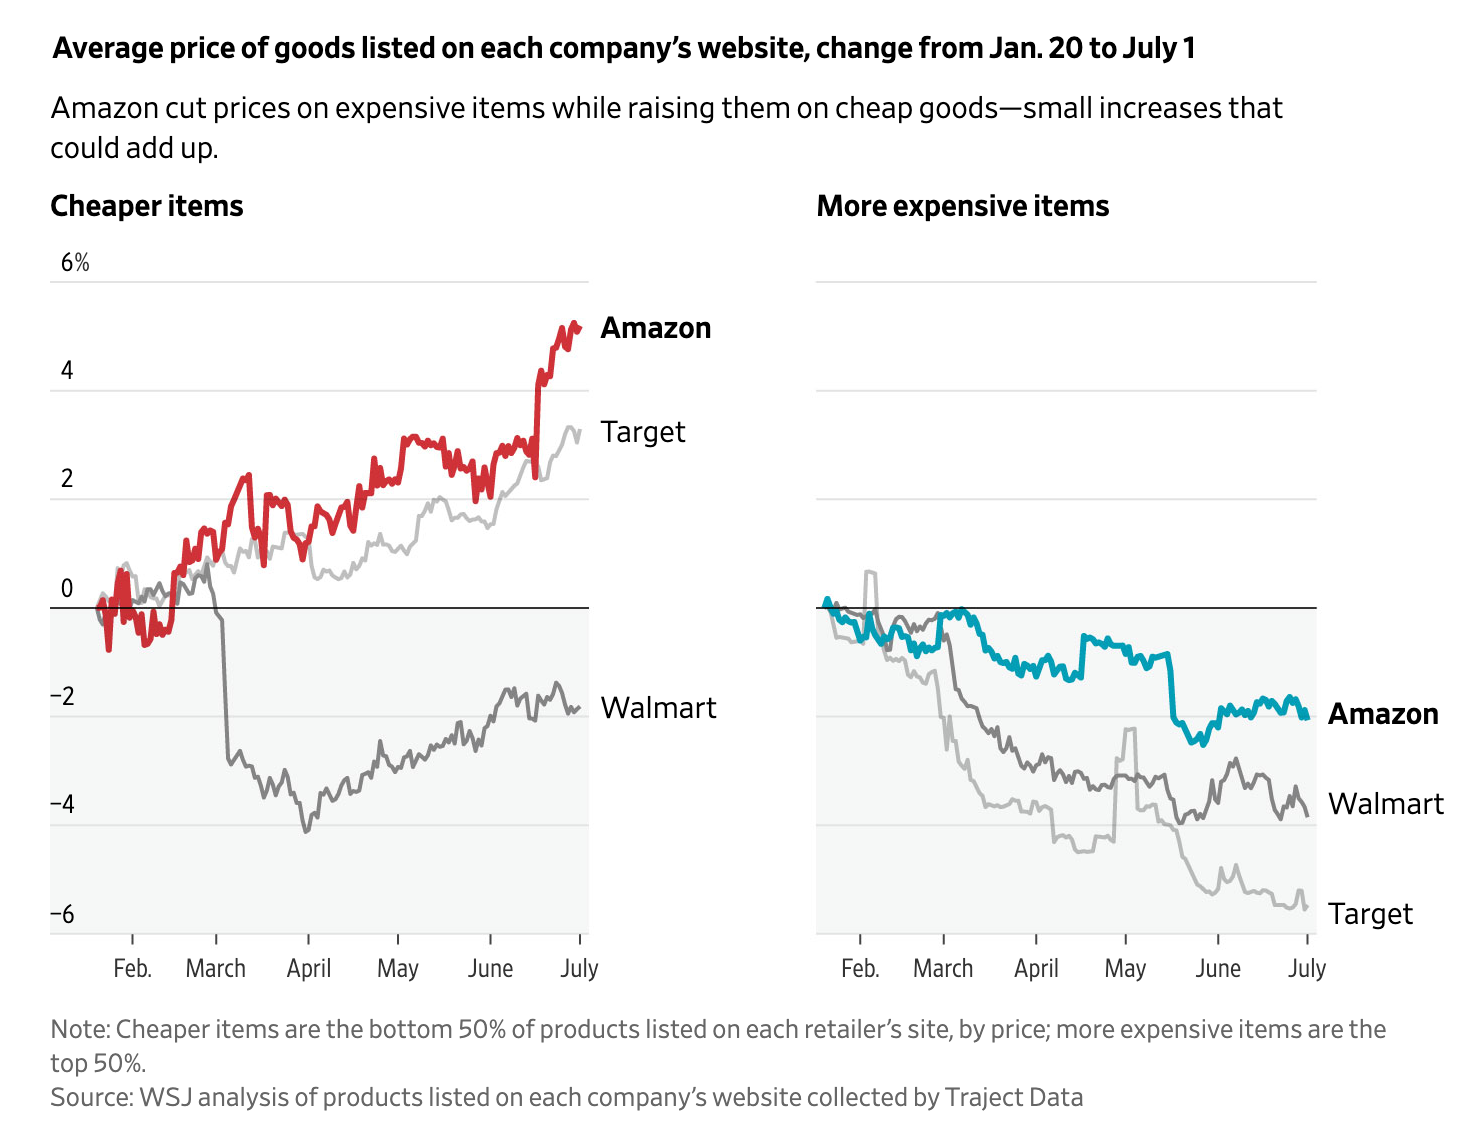
Is Walmart fetch or are they just bringing their prices more in line w/ Amazon’s and vice versa? Reporting the avg. dollar amount of similar, common goods would have helped here to interpret where to go as a consumer. Still, the contrast in recent strategies of the different companies is interesting
From https://www.wsj.com/business/retail/amazon-price-hikes-essentials-60a7c7f3?mod=hp_lead_pos8Weekend solar
Turns out 2x200W portable solar panels fit nicely on the top of a small SUV. On a sunny, summer day in NJ, the panels produce 140W each (70% of theoretical, always a bit underwhelming) which I store in two LiFePO4 batteries* that can hold ~1 kWh each. This means, accounting for passing clouds and occasional technical difficulties (each battery brand has its own set of flaws), I can typically charge both batteries from low (20%) to high (80%) within 6 hours. This equates to a total of ~1.2 kWh saved in a day. I then use this energy throughout the week to charge my phone, laptop, and headphones and/or power a box fan, vacuum, toaster, electric kettle, blender, microwave, etc.** Residential electricity in NJ costs $0.25-0.30 per kWh in total*** meaning I save a whopping 33 cents each time I do this. Incredible savings aside, it’s just cool to collect energy directly from the sun and use it to power everyday devices.
*I’m careful to monitor the temperature of the batteries throughout the day to ensure they don’t overheat. You don’t want to mess with lithium, especially when stored on top of more lithium (the car battery).
**1 kWh of electricity is enough to charge my laptop 10-20 times or my phone 30-50 times by direct current (DC) or my box fan for 16hr or my vacuum for 45 min by alternate current (AC).
***PSEG breaks down the cost of electricity into “supply” (18 cents per kWh) and “delivery” (10 cents per kWh). I previously thought this was dumb and ranted about it here. I need both things to have usable electricity in my apartment so why break it up other than to mislead customers I asked. Turns out, it’s because oil prices (electricity supply) can vary quite dramatically as the recent Strait of Hormuz standoff has demonstrated. So essentially the utility company breaks it down into our-fault (delivery) and not-our-fault (supply) categories. Pretty funny actually. Btw, PSEG also recently announced they’re updating their billing statements to be more transparent about costs so I feel like my previous rant was somewhat justified. They must read the blog. More likely, lots of people shared in my frustration, especially as energy costs continue to increase with acceleration, and PSEG took notice. Power (to) the people.


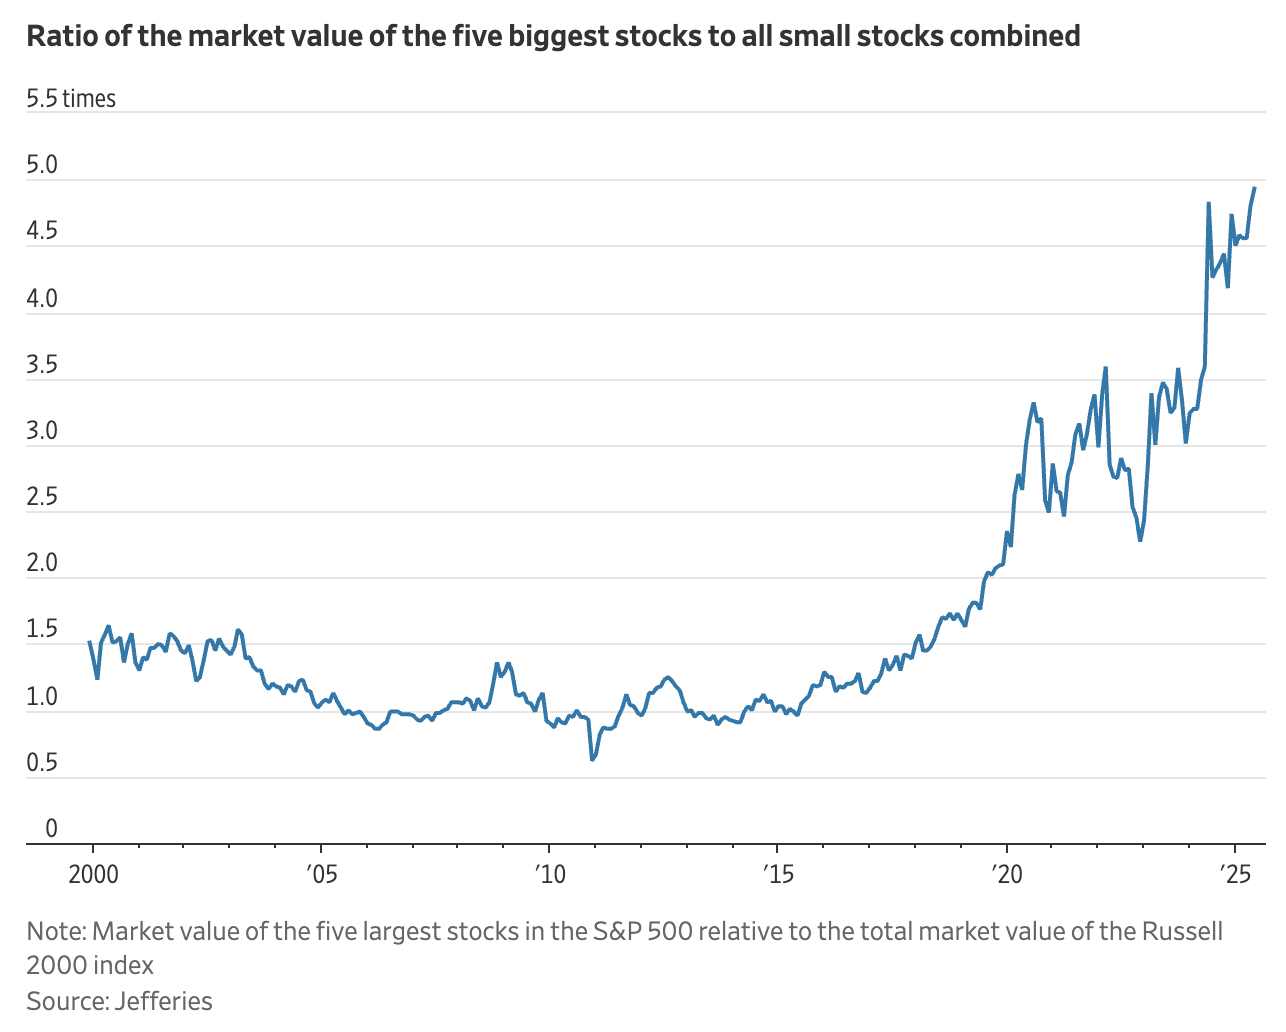
This is stark… market monopolization or a dramatic change in the methods of valuation? If the latter, caused by what? Investors playing it safe during/since the pandemic? A large increase in independent (“retail”) investors in this same time? AI hype? The article points to the latter but I think it may be a few things in combination
From https://www.wsj.com/finance/investing/small-stocks-bargain-85034233?mod=hp_lead_pos10Housing prices in the U.S.

Jan. 1999: $133,000 ($250,000 in today's dollar)
Jun. 2025: $435,000
So existing homes are now 1.75x (75%) more expensive than 25 years ago.
Few things appreciate like real estate. Even the avg. cost of a 4-year college degree, which most people agree is becoming egregious, only rose 40% from 2000-today when adjusted for inflation (Bloomberg)
This is great for homeowners and bad for new buyers. I wonder how much of the increase in price can be attributed to homes selling that are better built or larger (due to shifting societal standards, extensions, and remodels/renovations) than in the past? Perhaps it explains a small percentage of the 75% increase or none at all if overall build quality has actually dropped (for example b/c of cheaper, lower integrity or fewer materials being used in construction) over this time…
Regardless, homes are expensive.
From https://www.wsj.com/economy/housing/home-prices-hit-record-high-in-june-dragging-down-sales-aeda0cb9?mod=hp_lead_pos1Opinion
My grandfather asked me to review an article from the NYT as part of an ongoing discussion between him and some colleagues on the current state of the world. Here’s a link to the article and my response…